Marcelo Has
Senior Analytics Consultant
October 2, 2024
In today’s digital-first world, cloud services are essential for modern businesses. Companies rely on cloud providers like AWS, Azure, and Google Cloud to stay flexible, scalable, and competitive. But with this comes the challenge of managing costs effectively. If not monitored carefully, cloud spending can skyrocket, becoming a major business expense. Using data to analyze cloud resource consumption is a game-changer for companies focused on sustainable growth. Identifying areas for cost savings is crucial to keeping things under control.
This article walks you through how Tableau and the AWS Well-Architected Framework can help you cut costs, boost profitability, and make smarter decisions that align with your financial and business growth goals. We’ll use AWS as an example, but the same principles apply to other cloud providers.
Why the AWS Well-Architected Framework is Key to Cutting Cloud Costs

The AWS Well-Architected Framework is more than just a guide; it’s a blueprint for designing and operating cloud environments effectively. One of the most important pillars of this framework is Cost Optimization. It’s all about cutting out waste, using resources smarter, and ensuring your cloud spending is predictable and sustainable.
The results are even better when you pair this framework with a powerful data visualization tool like Tableau. Tableau can give you clear insights into how your cloud resources are being used, showing you exactly where savings can be made. Together, they can help you:
Improve profitability by identifying cost-saving opportunities.
Enhance operational efficiency by improving resource allocation.
Make data-driven decisions that align with your overall business goals.
How Tableau and the AWS Well-Architected Framework Work Hand in Hand

AWS generates an overwhelming amount of data, covering everything from resource usage to costs. The AWS Well-Architected Framework provides guidelines on how to manage and optimize these resources. Tableau steps in by taking this data and turning it into easy-to-understand visualizations, which help you make sense of it all. Here’s how this combination works to your advantage:
- Spot Usage Trends with Tableau Dashboards: AWS services like EC2, S3, and RDS produce detailed usage data. By plugging this data into Tableau, you can create interactive dashboards that show usage trends over time. The AWS Well-Architected Framework suggests regularly reviewing these patterns to eliminate unnecessary resources. Tableau makes this easy by offering real-time visuals that show exactly when and where your resources are being used (or wasted).
- Use Custom Tags for Detailed Analysis: AWS lets you create custom tags to group resources by team, department, product, or service. Tableau pulls these tags into dashboards, letting you track spending at a granular level. For instance, the Cost Optimization pillar of the AWS Well-Architected Framework encourages tagging resources so you can easily see if a particular team or project is using more resources than needed.
- Track and Compare Costs Over Time: The AWS Well-Architected Framework advises continuous monitoring of cloud costs. Tableau’s visualizations make it simple to keep tabs on costs in real time, as well as over weeks and months. You can set up dashboards that track cost spikes and drill down into specific services. This lets you ensure your team is sticking to the best practices for cost management.
- Implement Cost Controls with Tableau: AWS offers tools like AWS Cost Explorer and AWS Budgets to help set financial controls. But when you integrate them with Tableau, you can visualize these insights and make sense of them more easily. Tableau helps you apply cost controls by creating alerts and dashboards that notify you when cloud spending crosses certain thresholds, allowing for quick action before costs spiral out of control.
- Continuously Optimize for Growth: One of the main points of the AWS Well-Architected Framework is to continuously optimize your cloud setup as your business grows. Tableau helps facilitate this process by showing real-time data on usage and costs. For example, if an EC2 instance is underutilized, you can spot it easily on a Tableau dashboard and take action—whether that’s downsizing or turning it off completely.
Real-World Example: Tableau Dashboard for Cloud Cost Management in Tableau
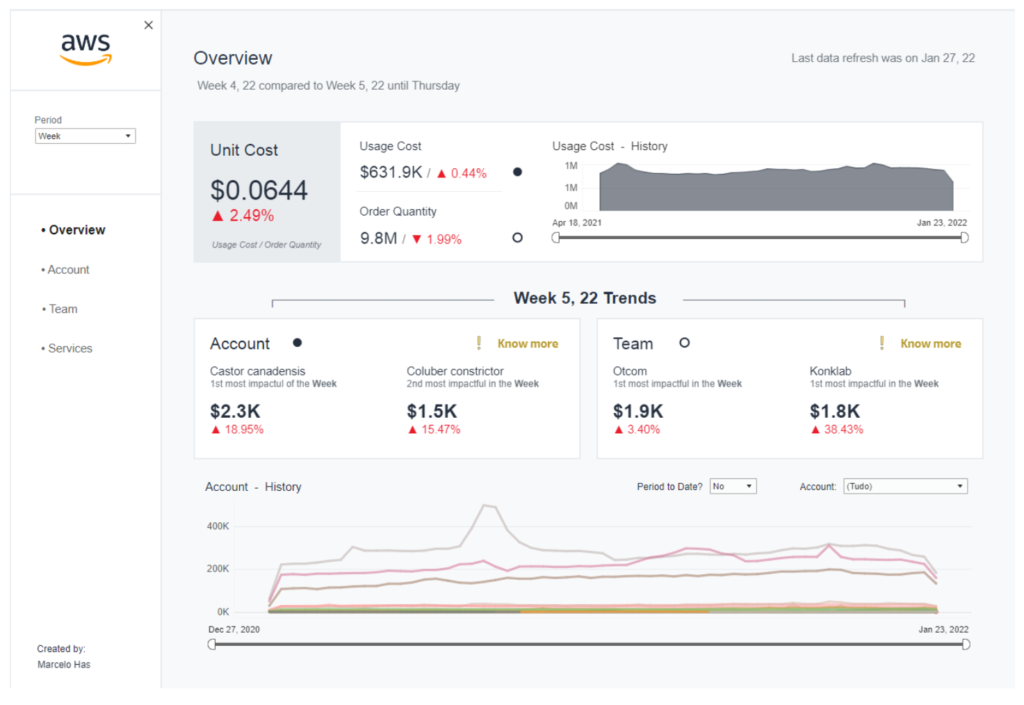
To show how these strategies can work in practice, let’s look at a Tableau dashboard designed for managing cloud costs and resource consumption. This dashboard is structured to offer detailed insights into key metrics while allowing for deeper exploration into specific areas of cost management:
Overview Page: This page shows the big picture with essential metrics like unit cost, usage cost, and order quantity. It’s particularly useful for tracking variance trends by billing accounts and teams (custom tags). It highlights the top two areas that are driving cost fluctuations, helping decision-makers quickly identify where action is needed.
Account Page: The account page focus on usage cost while also showing how much of the cost is properly tagged for analysis. Users can drill down into specific AWS services, teams, internal company services, and data transfer costs. As in the overview page, this page also has variance trends, showing details by team and internal company services.
Team Page: The team page has the same structure as the account page but focuses specifically on tracking cloud usage and costs at the team level. It has a “tagged” metric to track how much of all cloud resources are tagged correctly and that teams can monitor their usage efficiently.
Service Page: This page focuses on cost over time, which is crucial for identifying outliers and unexpected cost spikes. With this page teams can track trends over time, spot unusual cost increases in AWS services and take action before it impacts the overall budget.

(https://public.tableau.com/app/profile/marcelo.has/viz/AWSCostManagement/Overview)
Tableau Public Dashboard by Marcelo Has
This kind of dashboard is a perfect example of how businesses can use Tableau to manage their cloud costs. It provides a clear, visual breakdown of resource usage, enabling companies to align their cloud strategies with AWS Well-Architected principles and keep spending in check.
Tableau’s Impact on Business Growth Through the AWS Well-Architected Framework
Using Tableau alongside the AWS Well-Architected Framework offers major benefits to businesses, especially those in growth phases:
Improving Profitability: Tableau’s visual insights, combined with the best practices from AWS’s framework, help businesses find areas where they can reduce cloud costs. These savings directly improve profitability by eliminating waste and driving more efficient cloud use.
Enhancing Operational Efficiency: The Operational Excellence and Cost Optimization pillars of the AWS Well-Architected Framework highlight the importance of proper resource allocation. Tableau enables teams to visualize resource usage clearly, making it easier to spot inefficiencies and optimize cloud operations.
Supporting Data-Driven Growth: As your business grows, your cloud usage will increase too. Tableau allows you to monitor these changes and cost patterns over time, ensuring you can scale confidently. By following the AWS Well-Architected Framework and leveraging Tableau’s detailed analytics, you can make informed, data-driven decisions about resource allocation and cost control.
Conclusion
After combining Tableau with the AWS Well-Architected Framework, we are able to create a robust approach to cloud cost management. This combination has helped and can help many companies save money, optimize their use of resources, and make smarter financial decisions.
As cloud usage increases, managing costs effectively becomes essential. With the right tools and strategies, including Tableau and the AWS Well-Architected Framework, businesses can confidently control cloud spending while focusing on what truly matters—growth, profitability, and innovation.

Marcelo Has
Marcelo has extensive experience in various areas such as Data Product, Dashboard Design, Data Engineering, Data Visualization, Storytelling, and Web Development. He is 2x #VizOftheDay, and 5x Tableau Certified (Including Customer Success). Marcelo is the creator of the Tableauzando YouTube channel, where he publishes free content on Tableau and Design within Tableau.
He also built the Tableau Data Dictionary Generator, a free tool where you can use your .twb or .twbx file to generate a data dictionary in seconds without worrying about data security.
As one of the Career PathMakers TUG leaders he helps different people around the world with their career growth, and has been mentioned multiple times over different community events and Tableau Conferences due to his contributions.
Are You Prepared to Maximize Your Cloud Savings?
Avoid letting excessive cloud costs erode your revenues! Start on the path to wiser financial oversight by utilizing the power of Tableau alongside the AWS Well-Architected Framework. Uncover dynamic insights that can significantly reduce expenses and boost your operational effectiveness. Join the ranks of numerous firms that have revolutionized their cloud tactics through informed decision-making.


