Swift Insights and Tableau Deliver Real-Time Executive Intelligence fora $2B Wealth Management Firm
A leading $2 billion wealth management firm overseeing thousands of client relationships across multiple regions recognised that its existing analytics infrastructure could no longer keep pace with executive decision-making. Client data was scattered across custodians, asset classes, and advisory teams. The firm lacked a unified, real-time view of portfolio health, client engagement, and regional performance.To address this, the firm partnered with Swift Insights to design and build a purpose-built executive
intelligence dashboard powered by Tableau and Snowflake. The result is a real-time command centre that
gives leadership instant visibility into client health, asset performance, net flows, and regional trends.
Overcoming Fragmented Data to Unlock Executive Visibility
The firm’s existing analytics environment relied on siloed reporting across multiple custodians and asset classes. Relationship managers manually stitched together client views using spreadsheets and static
reports. Executives received end-of-day summaries that were already outdated by the time they arrived.
This operating model limited the firm’s ability to respond quickly to emerging risks or opportunities.Several structural challenges stood in the way:
Fragmented Client Data: Portfolio positions, transaction history, and engagement records lived in separate systems, making a unified client view impossible without significant manual effort.
Slow Executive Reporting: Batch-based processing meant leadership lacked real-time insight into asset flows, portfolio risk, and client behaviour.
No Early-Warning System: The firm had no automated mechanism to identify at-risk client relationships before engagement levels or assets declined.
Limited Regional Visibility: Performance was tracked in isolation by region, preventing meaningful comparison or benchmarking across geographies.
The Solution: Real-Time Executive Intelligence with Swift Insights, Tableau, and Snowflake
Swift Insights designed a cloud-native analytics architecture built on Snowflake, with Tableau as the
visualisation layer. The platform consolidated client, portfolio, and transaction data into a single source of
truth, enabling leadership to move from retrospective reporting to real-time, insight-driven decision-making.
Building a Unified Client Health Framework
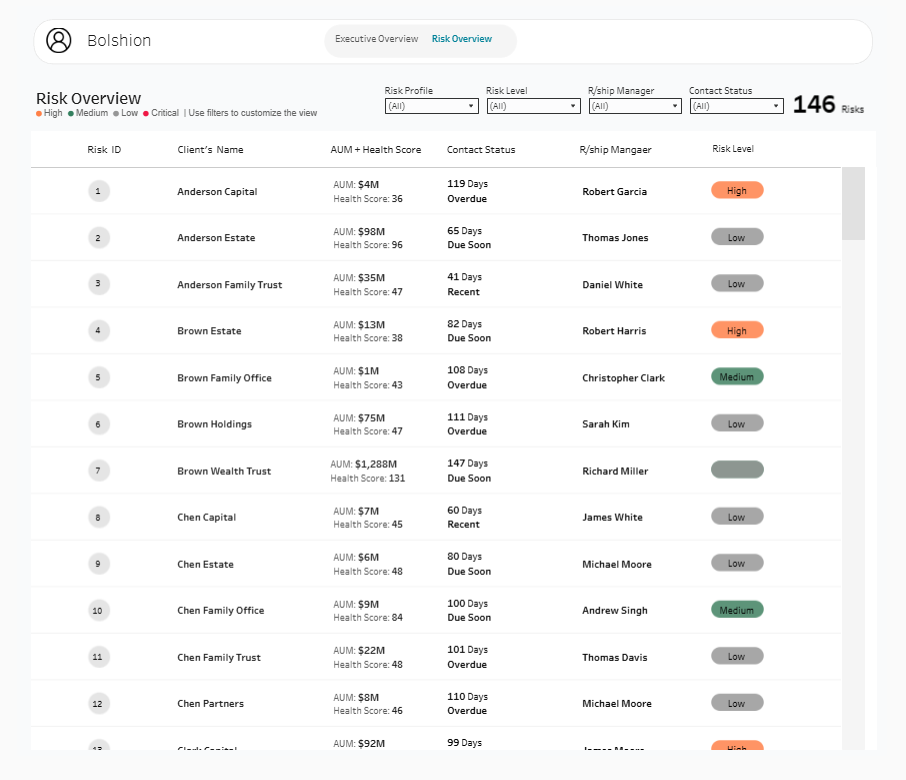
At the core of the solution is a composite Client Health Score. This 0 to 100 metric weighs engagement
frequency, portfolio performance, net asset flows, and client satisfaction signals. The dashboard displays
this score alongside clear segmentation. Clients are categorised as Thriving (80+), Stable (50-79), or AtRisk (below 50).The framework enables several critical capabilities:
Real-Time Health Monitoring: Relationship managers can immediately see which clients are thriving, stable, or at risk. The dashboard updates continuously throughout the day.
Visual Risk Alerts: The Client Health panel uses colour-coded indicators to highlight clients requiring attention, allowing teams to prioritise outreach before issues escalate.
Advisor-Level Accountability: Client portfolios are tracked at the relationship manager level, creating a data-driven foundation for performance review and proactive engagement.
Delivering Real-Time Executive Command Centre Dashboards
Swift Insights built an integrated executive dashboard with several interconnected views, each designed for a specific decision-making context:
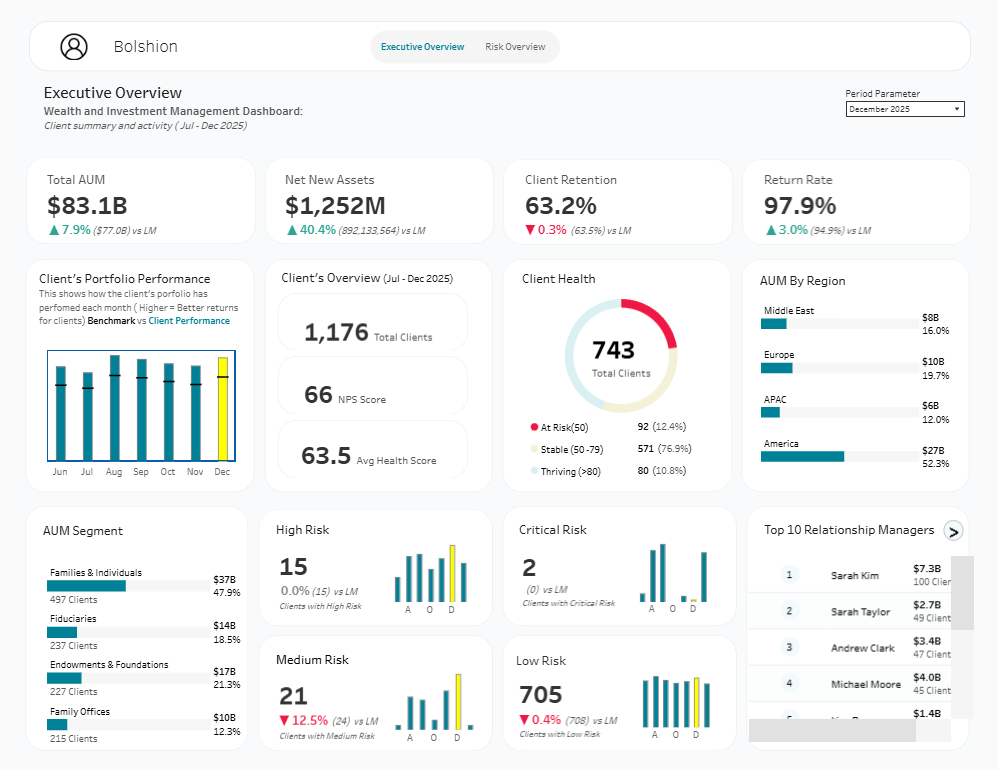
Executive Overview: A single-screen view of total AUM ($80.0B), net new assets ($1.1B), client retention (62.2%), and return rate (97.9%). Real-time trend indicators show month-over-month changes.
Client Health Distribution: A donut chart showing the breakdown of 732 total clients across three health categories. 67 clients (9.2%) are flagged as Thriving, 575 (78.5%) as Stable, and 90 (12.3%) as At-Risk.
AUM by Region: A horizontal bar chart displaying asset distribution across four regions. America holds $25B (49.8%), Europe $11B (21.2%), Middle East $8B (16.4%), and APAC $6B (12.6%).
Portfolio Performance: A monthly bar chart comparing client portfolio performance against the benchmark, giving executives immediate visibility into where the firm is outperforming or underperforming.
Top Relationship Managers: A ranked view showing AUM and client count by advisor, enabling leadership to identify top performers and assess capacity across the team.
Risk Monitoring: Dedicated panels tracking High Risk clients (13 clients, 0.0% of AUM) and Critical Risk clients (1 client, representing 50.0% reduction vs. prior period), with micro-trend charts showing weekly patterns.
Setting the Foundation for Continuous Visibility
The executive intelligence platform was designed to scale alongside the firm’s strategic roadmap. The underlying Snowflake architecture supports the addition of new data sources and reporting views without requiring a rebuild of the core system.As the firm looks ahead, the dashboard foundation enables several potential expansions:
Enhanced Alerting: Extending automated alerts through Tableau’s native notification capabilities, ensuring the right insight reaches the right person at the right time.
Deeper Segmentation: Adding client cohort analysis and retention tracking to identify patterns in client engagement and asset flows.
Expanded ESG Reporting: Building additional dashboards to track impact investments alongside financial performance, meeting growing regulatory and client demand for transparency
Explore how Swift Insights can help your organisation build executive-grade dashboards that leadership
will actually use. Contact us today to get started.
Swift Insights is an all-star analytics team that helps you achieve quick results with actionable insights. Helping you drive your business forward with data driven decisions.
We use cookies to ensure that we give you the best experience on our website. If you continue to use this site we will assume that you are happy with it.