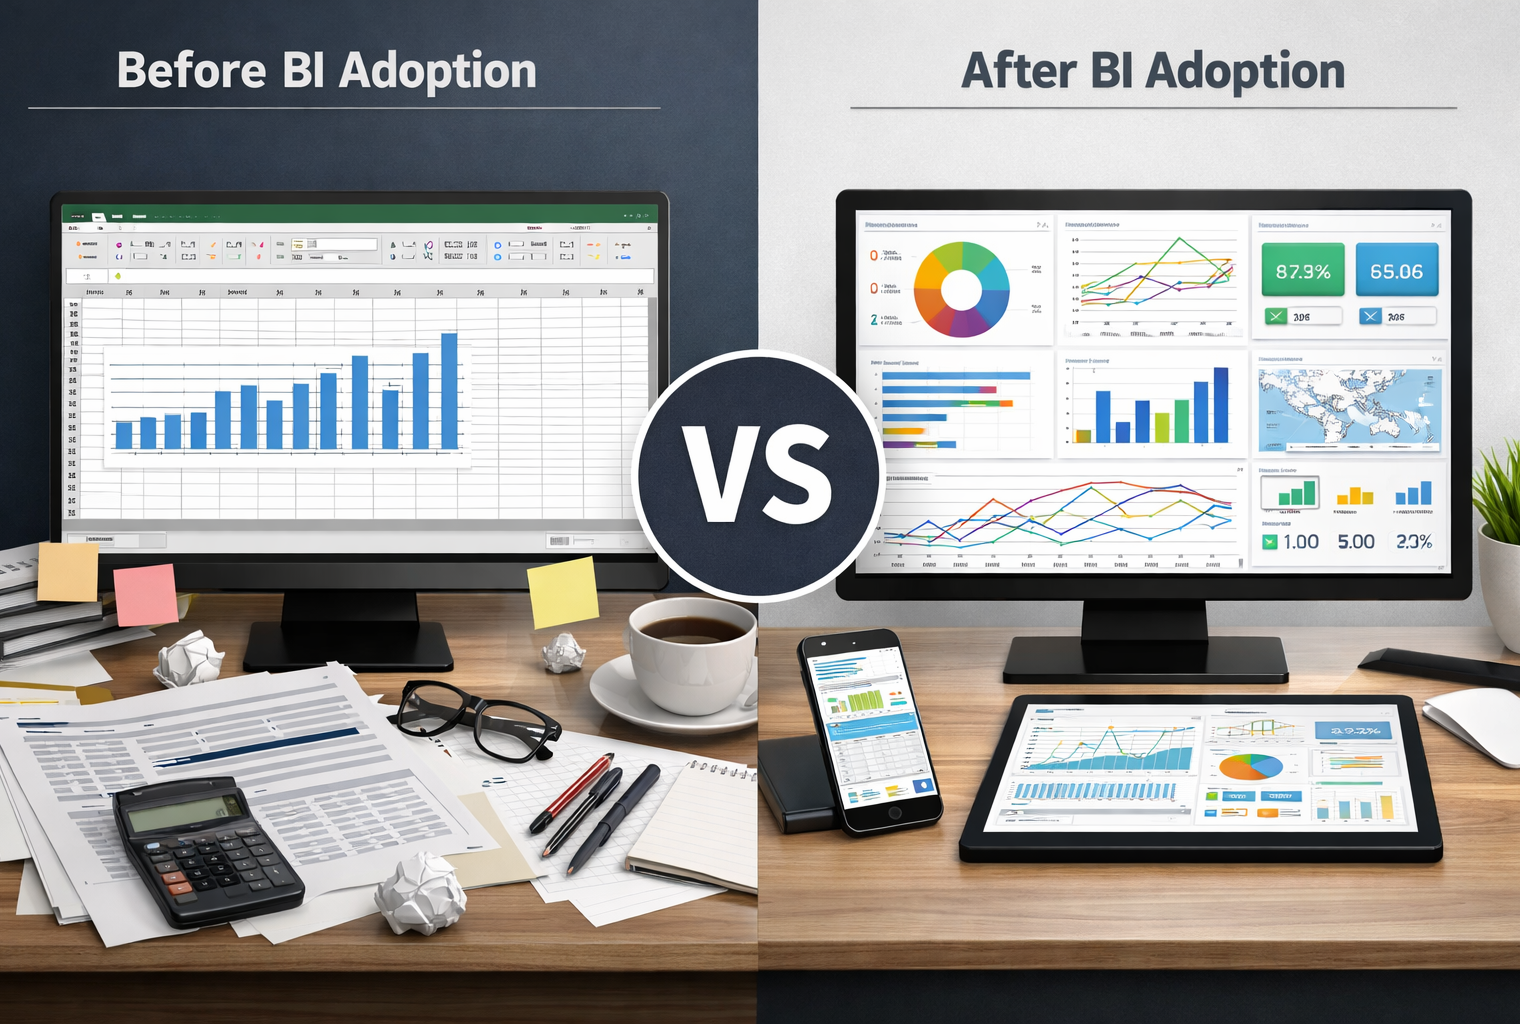
Many organizations entering an excel to bi transition expect clearer reporting, faster insights, and fewer spreadsheets.
Instead, teams often experience the opposite. Reporting feels heavier. Dashboards multiply. Executives question the numbers. Analysts spend more time explaining metrics than improving them.
This pattern shows up repeatedly during an excel to bi transition. The issue is not the tools. The issue is execution.
Excel Was Never the Real Problem
Despite years of investment in modern analytics platforms, Excel remains central to enterprise decision making.
Reporting by the BBC on Microsoft’s continued reliance on Excel highlights a reality many leaders recognize: spreadsheets remain widely used even inside organizations that have already deployed BI tools.
Excel allows leaders to move fast. It lets them test assumptions, adjust logic, and answer questions without waiting for centralized pipelines. As explored in discussions about the ongoing role of Excel in enterprise BI, spreadsheets absorb unclear ownership and undocumented definitions quietly.
Excel did not create reporting problems. It hid them.
BI Exposes Problems, It Does Not Fix Them
When teams move from Excel to BI, they expect simplification. BI instead exposes every inconsistency.
Dashboards surface conflicting definitions. Metrics that teams adjusted silently in spreadsheets now collide in leadership meetings. Questions that Excel buried now demand answers.
Industry research summarized by IBM shows a consistent pattern: BI adoption often drops after initial rollout when dashboards are not clearly tied to decisions and ownership.
BI platforms scale structure. Without decision discipline, that structure amplifies confusion.
Why Teams Recreate Excel Inside BI Tools
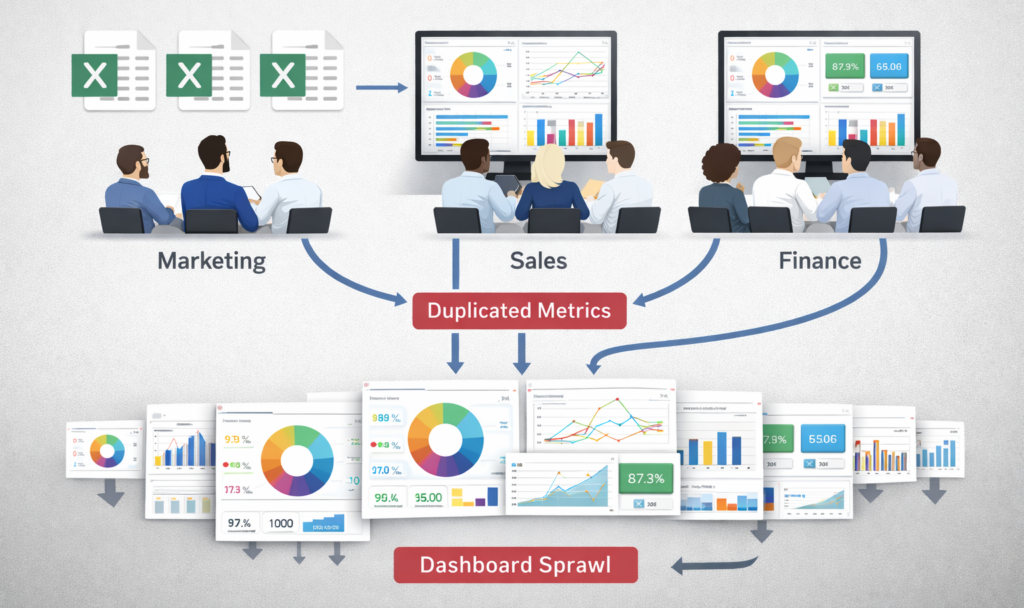
The moment BI feels slow or rigid, teams rebuild Excel behavior inside dashboards.
They create one dashboard per request. They duplicate metrics to satisfy different audiences. They export data back to spreadsheets to answer urgent questions.
This behavior reflects how managers work under pressure. As discussed in why managers still rely on spreadsheets, speed and control matter more than system elegance when decisions are on the line.
Over time, BI backlogs grow. Analysts become report producers instead of problem solvers. This is why many organizations find that internal BI teams struggle to keep up with growing demand.
What Actually Needs to Change for BI to Simplify Work
BI simplifies work only when organizations redesign execution around decisions.
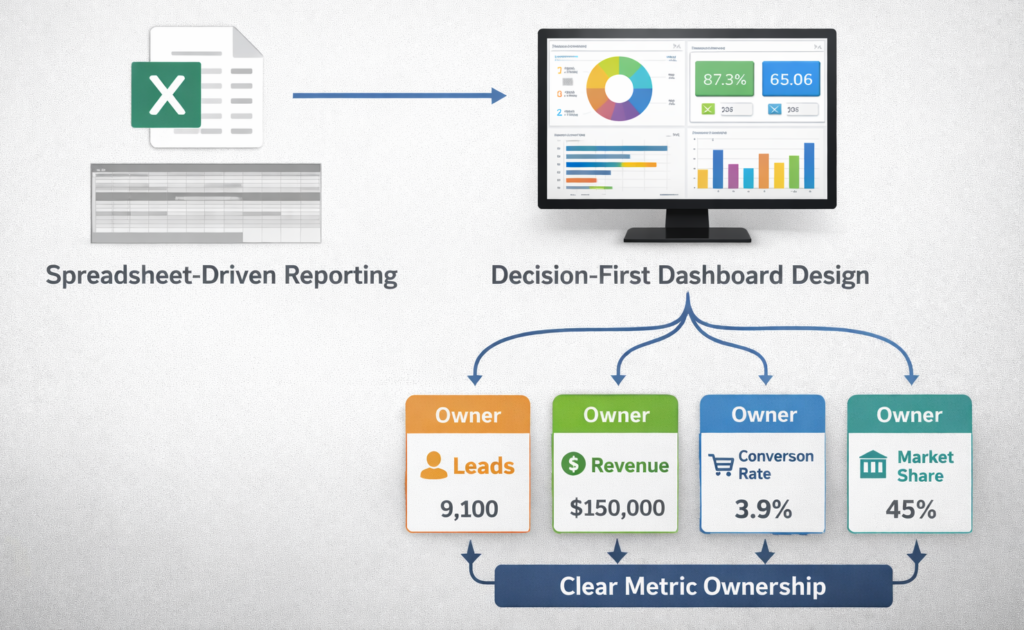
Teams must define decisions before building dashboards. Each dashboard should support a specific decision owned by a named role.
Metric ownership must be explicit. Teams should agree on definitions before publishing dashboards, not debate them afterward.
Governance should operate as a workflow. The goal is clarity at decision time, not control for its own sake.
When these foundations exist, reporting complexity drops. When they do not, BI increases friction.
How Swift Insights Approaches Excel to BI Transitions
Swift Insights treats the excel to bi transition as an execution change, not a technology swap.
The work starts with decision alignment, followed by metric ownership, and only then visualization. This sequence prevents teams from recreating spreadsheet chaos inside modern BI tools.
This approach aligns with the five questions every CDO must be asking right now and explains why organizations pair internal teams with external partners as BI demand grows.