How to Migrate an Excel Forecast to Sigma: A Private Equity Example
We took a private equity fund forecast built in Excel and moved it into Sigma with one prompt, using Sigma's Excel migration skill. Every total matched Excel to the cent, and the forecast assumptions stayed editable.
A private equity fund forecast usually mixes two kinds of numbers: actuals summed from transaction records, and assumptions such as growth rates for some share classes and typed-in amounts for known commitments and repurchases. The question for a finance team is whether a forecast like that can move to Sigma without losing a cent of accuracy or the ability to change assumptions. This post shows how we migrated one, how to prepare your own workbook, and what we had to fix along the way.
Sigma’s Excel migration skill
Sigma recently released an open-source Excel migration skill. It reads a spreadsheet forecast, rebuilds it as a Sigma workbook, and checks that the numbers match. Sigma’s own demo used a made-up software company’s forecast. We wanted to see how it handled a fund forecast built from real data, because that is the kind of workbook our private equity clients actually bring us.
The source workbook
We built the forecast from public data for Blackstone Private Equity Strategies Fund (BXPE), an evergreen private equity fund. Money coming in is taken from the fund’s SEC filings of share sales by share class, and money going out is taken from its reported repurchases. No confidential or client data was used.
The forecast covers twelve months, April 2026 to March 2027. The first six months are actuals and the last six are forecast. The workbook has three sheets: the Forecast statement, a GL sheet with 31 transaction rows, and a Drivers sheet with the growth rates.
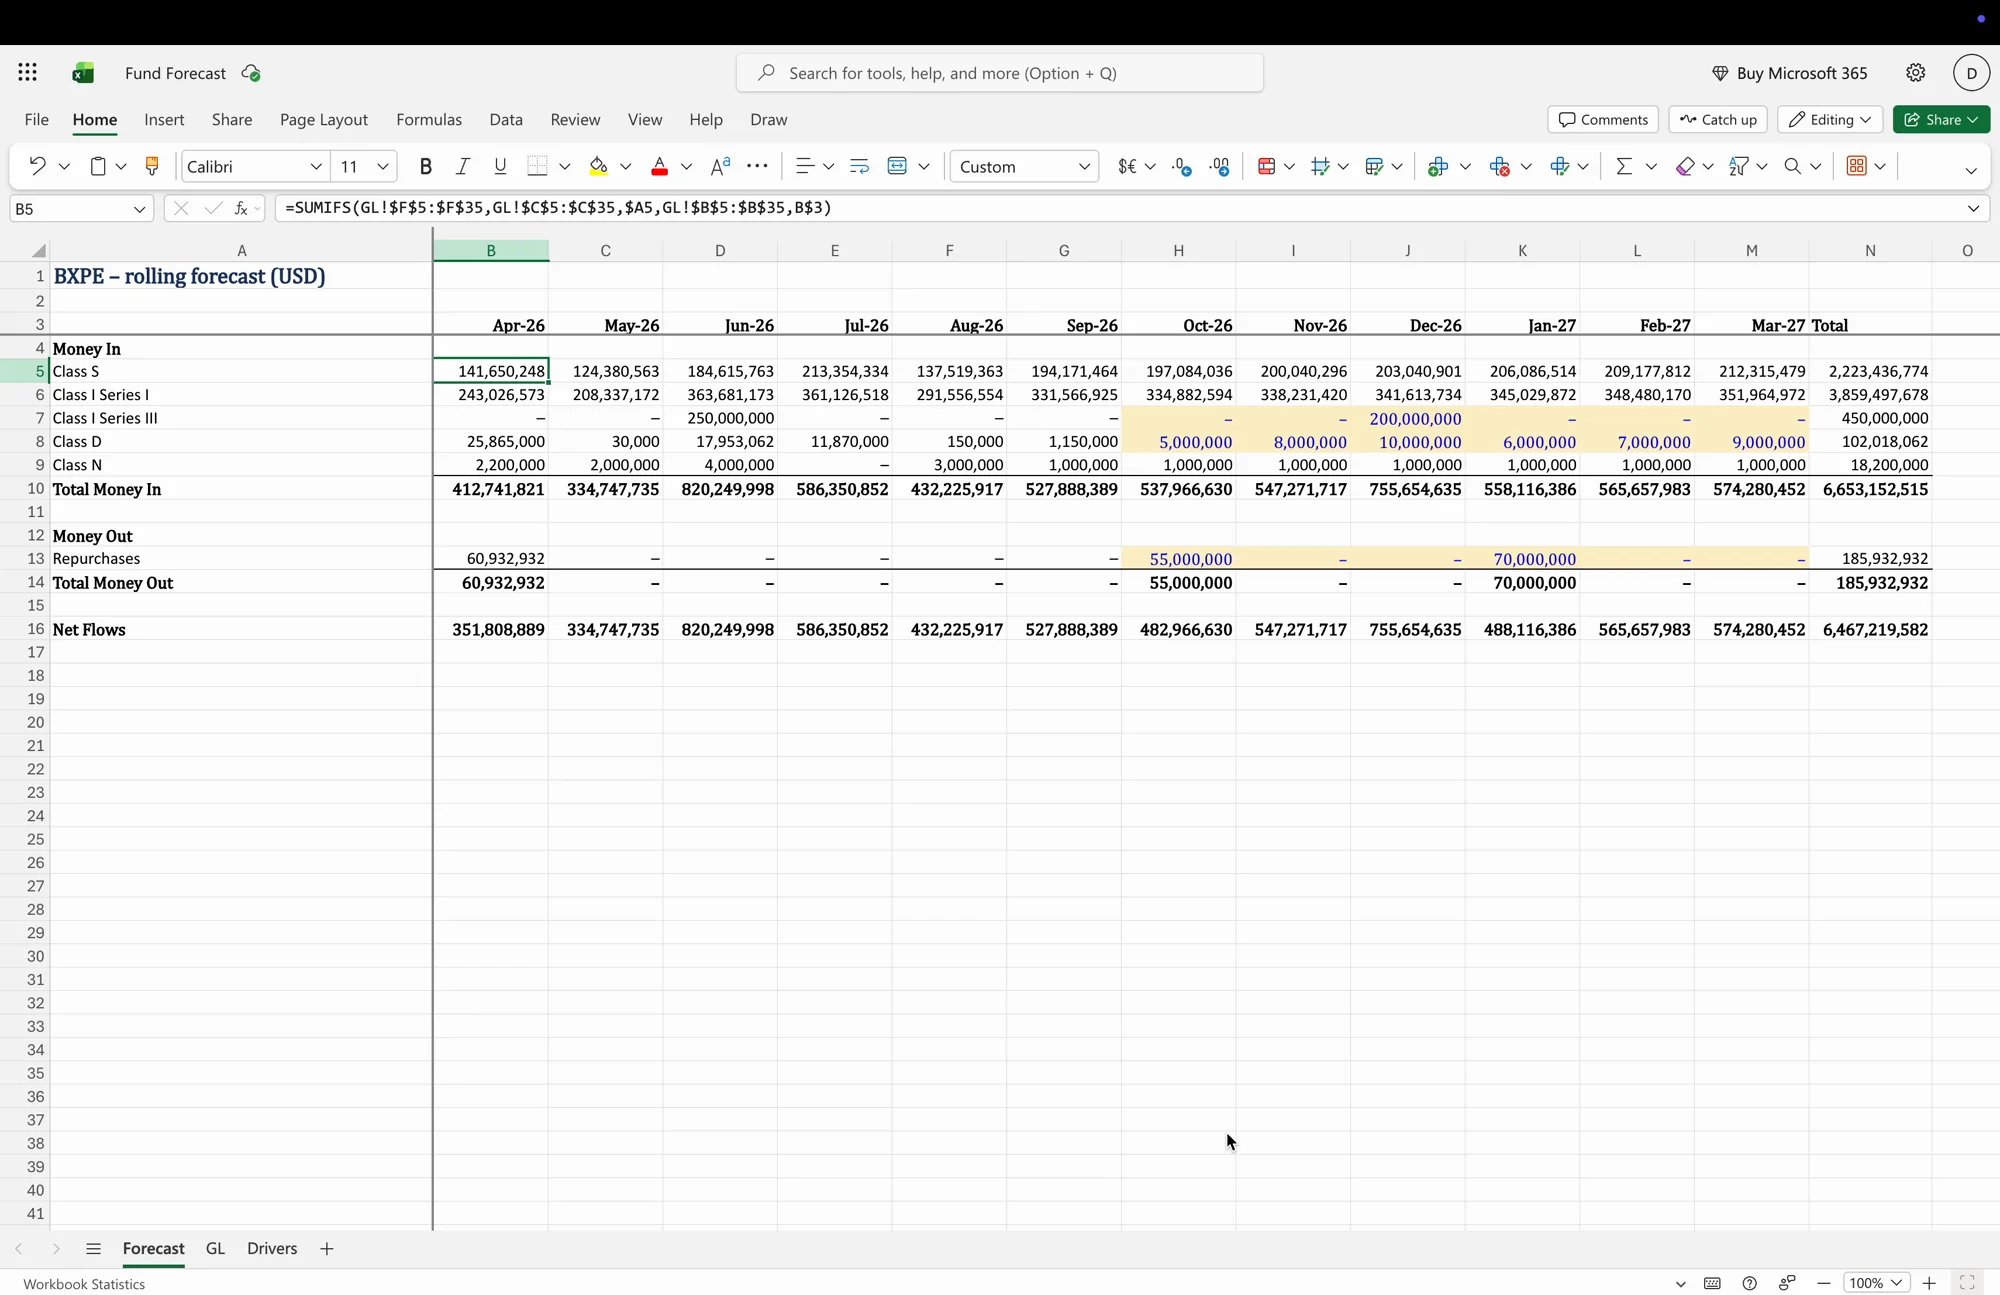
Excel. The Forecast sheet. Actual months use SUMIFS over the GL sheet; the yellow cells are typed-in forecast amounts.
Actual months add up the GL rows with SUMIFS. Each forecast line uses one of three methods:
- Class S: Grows 1.5% a month
- Class I Series I: Grows 1.0% a month
- Class I Series III: Typed in by hand, including a $200M ticket in December 2026
- Class D: Typed in by hand
- Class N: Carries last month forward
- Repurchases: Typed in by hand: $55M in October 2026 and $70M in January 2027
How the migration ran
We gave Claude Code a single prompt to migrate the file. The skill then worked through five stages:
- Audit. It read every formula in the workbook and confirmed the file was a forecast it could rebuild.
- Plan and self-check. Before touching Sigma, it rebuilt the forecast on its own and checked 108 cells against Excel. All of them matched.
- Review. It stopped and asked a person to confirm one thing: the Class N line simply repeats last month. That was intended, so we signed it off. This step matters, because a forecast often contains judgment calls that only the owner can confirm.
- Build. It created a Sigma data model and a workbook with the headline numbers, a monthly trend chart, the full statement with actual and forecast columns, an Inputs page with editable tables, and a page with the GL detail.
- Check the totals. It compared the totals in Sigma with the totals in Excel.
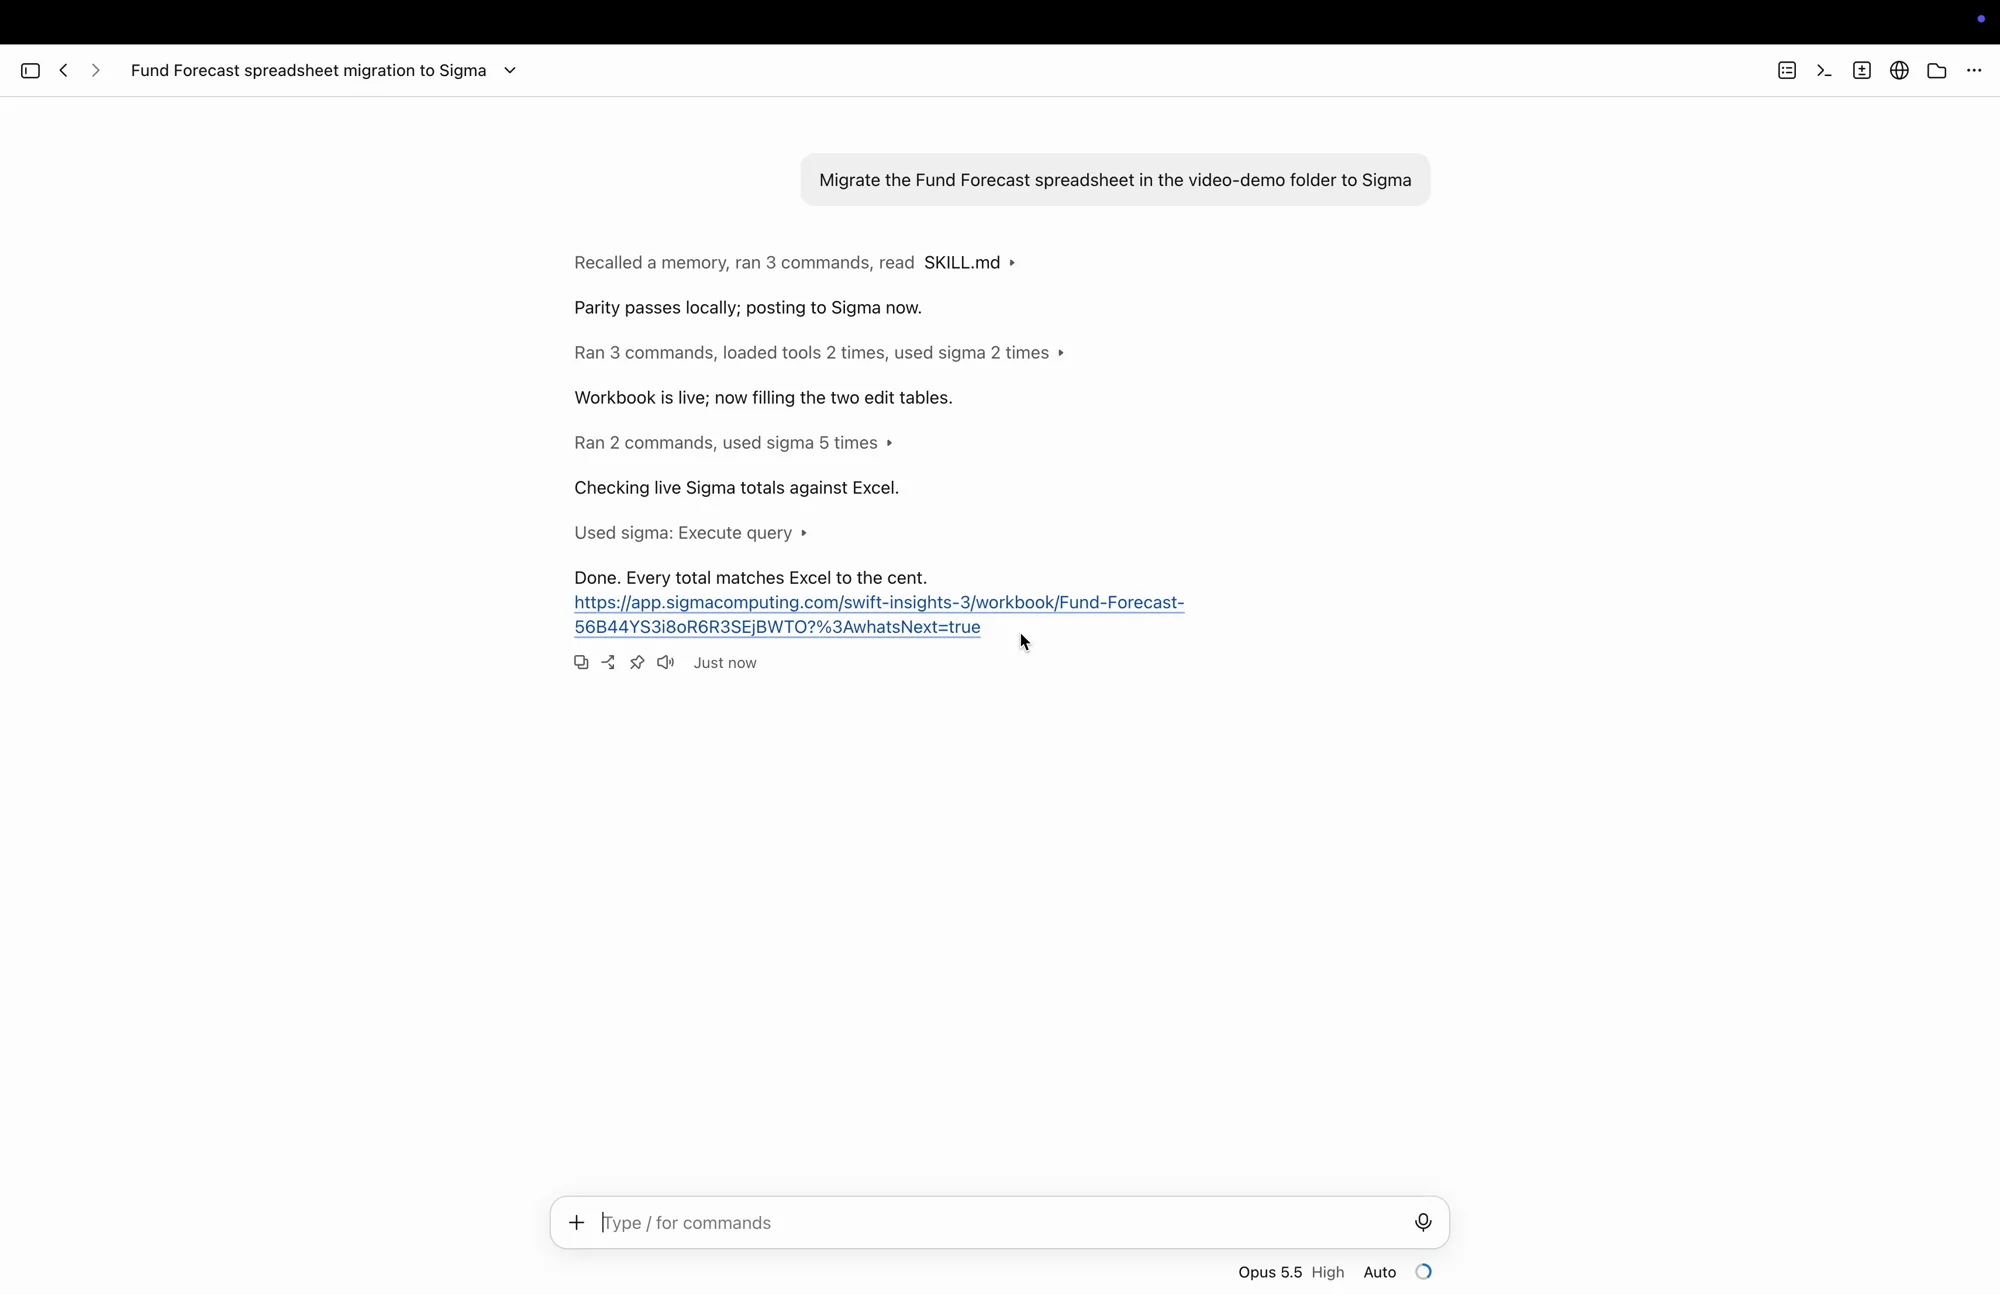
Claude Code. One prompt in, and the run ends by confirming that every total matches Excel.
We kept the workbook exactly as the skill built it, without restyling, so what you see is the skill’s own output.
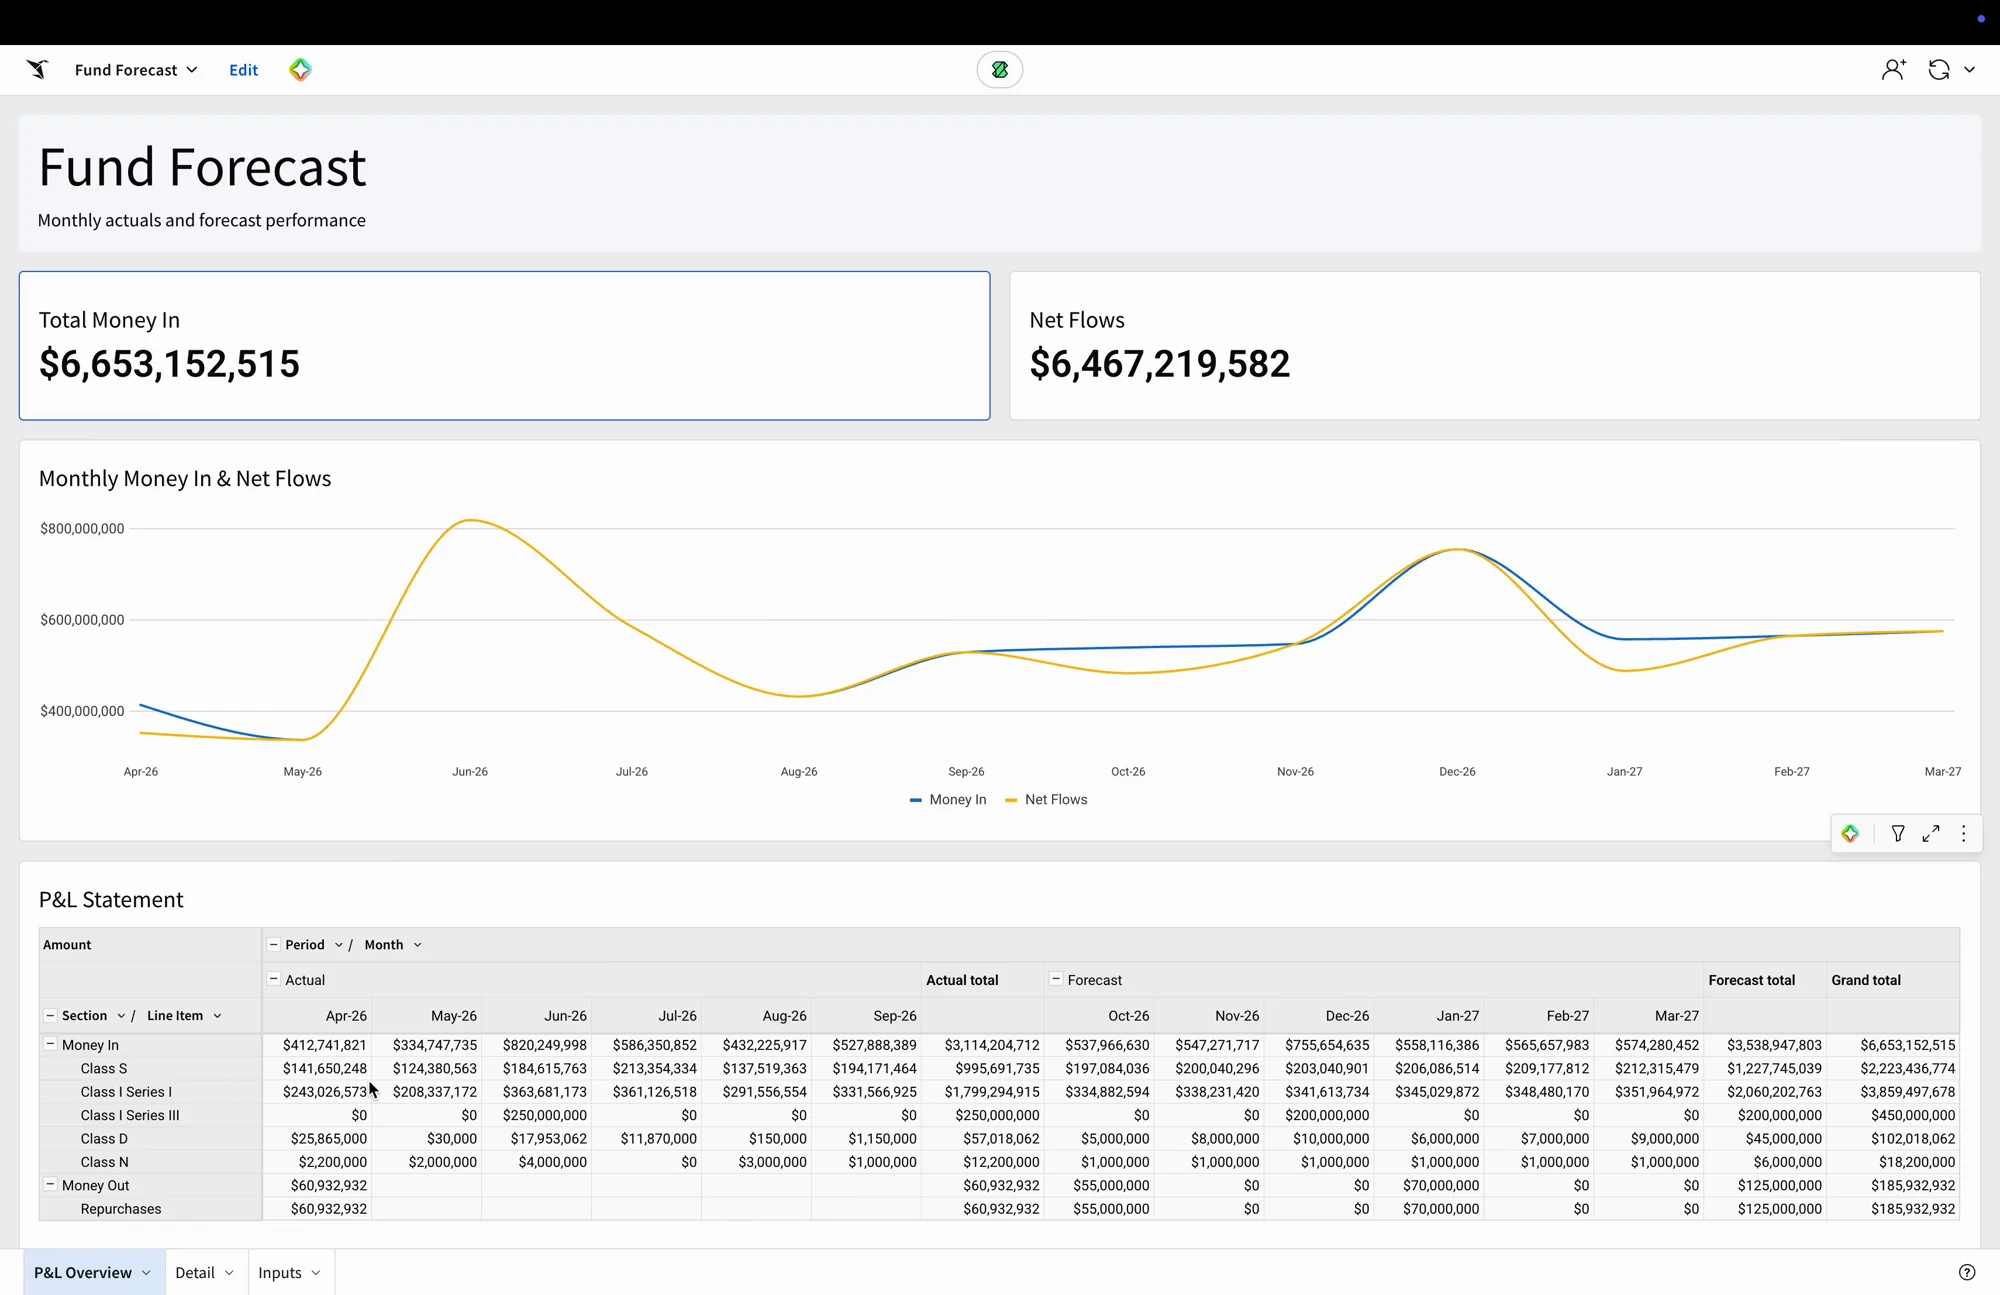
Sigma. The workbook the skill built: headline totals, a monthly trend chart, and the statement with actual and forecast columns.
Parity with Excel
All three totals matched Excel to the cent:
- Total money in: $6,653,152,514.60
- Total money out: $185,932,932.36
- Net flows: $6,467,219,582.24
The largest difference on any total was 0.000005 of a dollar, which is rounding inside the calculation.
Testing a change in assumptions
The point of a forecast is to test what happens when an assumption changes. On the Inputs page, we raised Class S growth from 1.5% to 3% a month. The Class S total for the six forecast months went from $2,223,436,774.41 to $2,289,351,770.50, an increase of $65,914,996.09. That matched our own calculation to the cent.
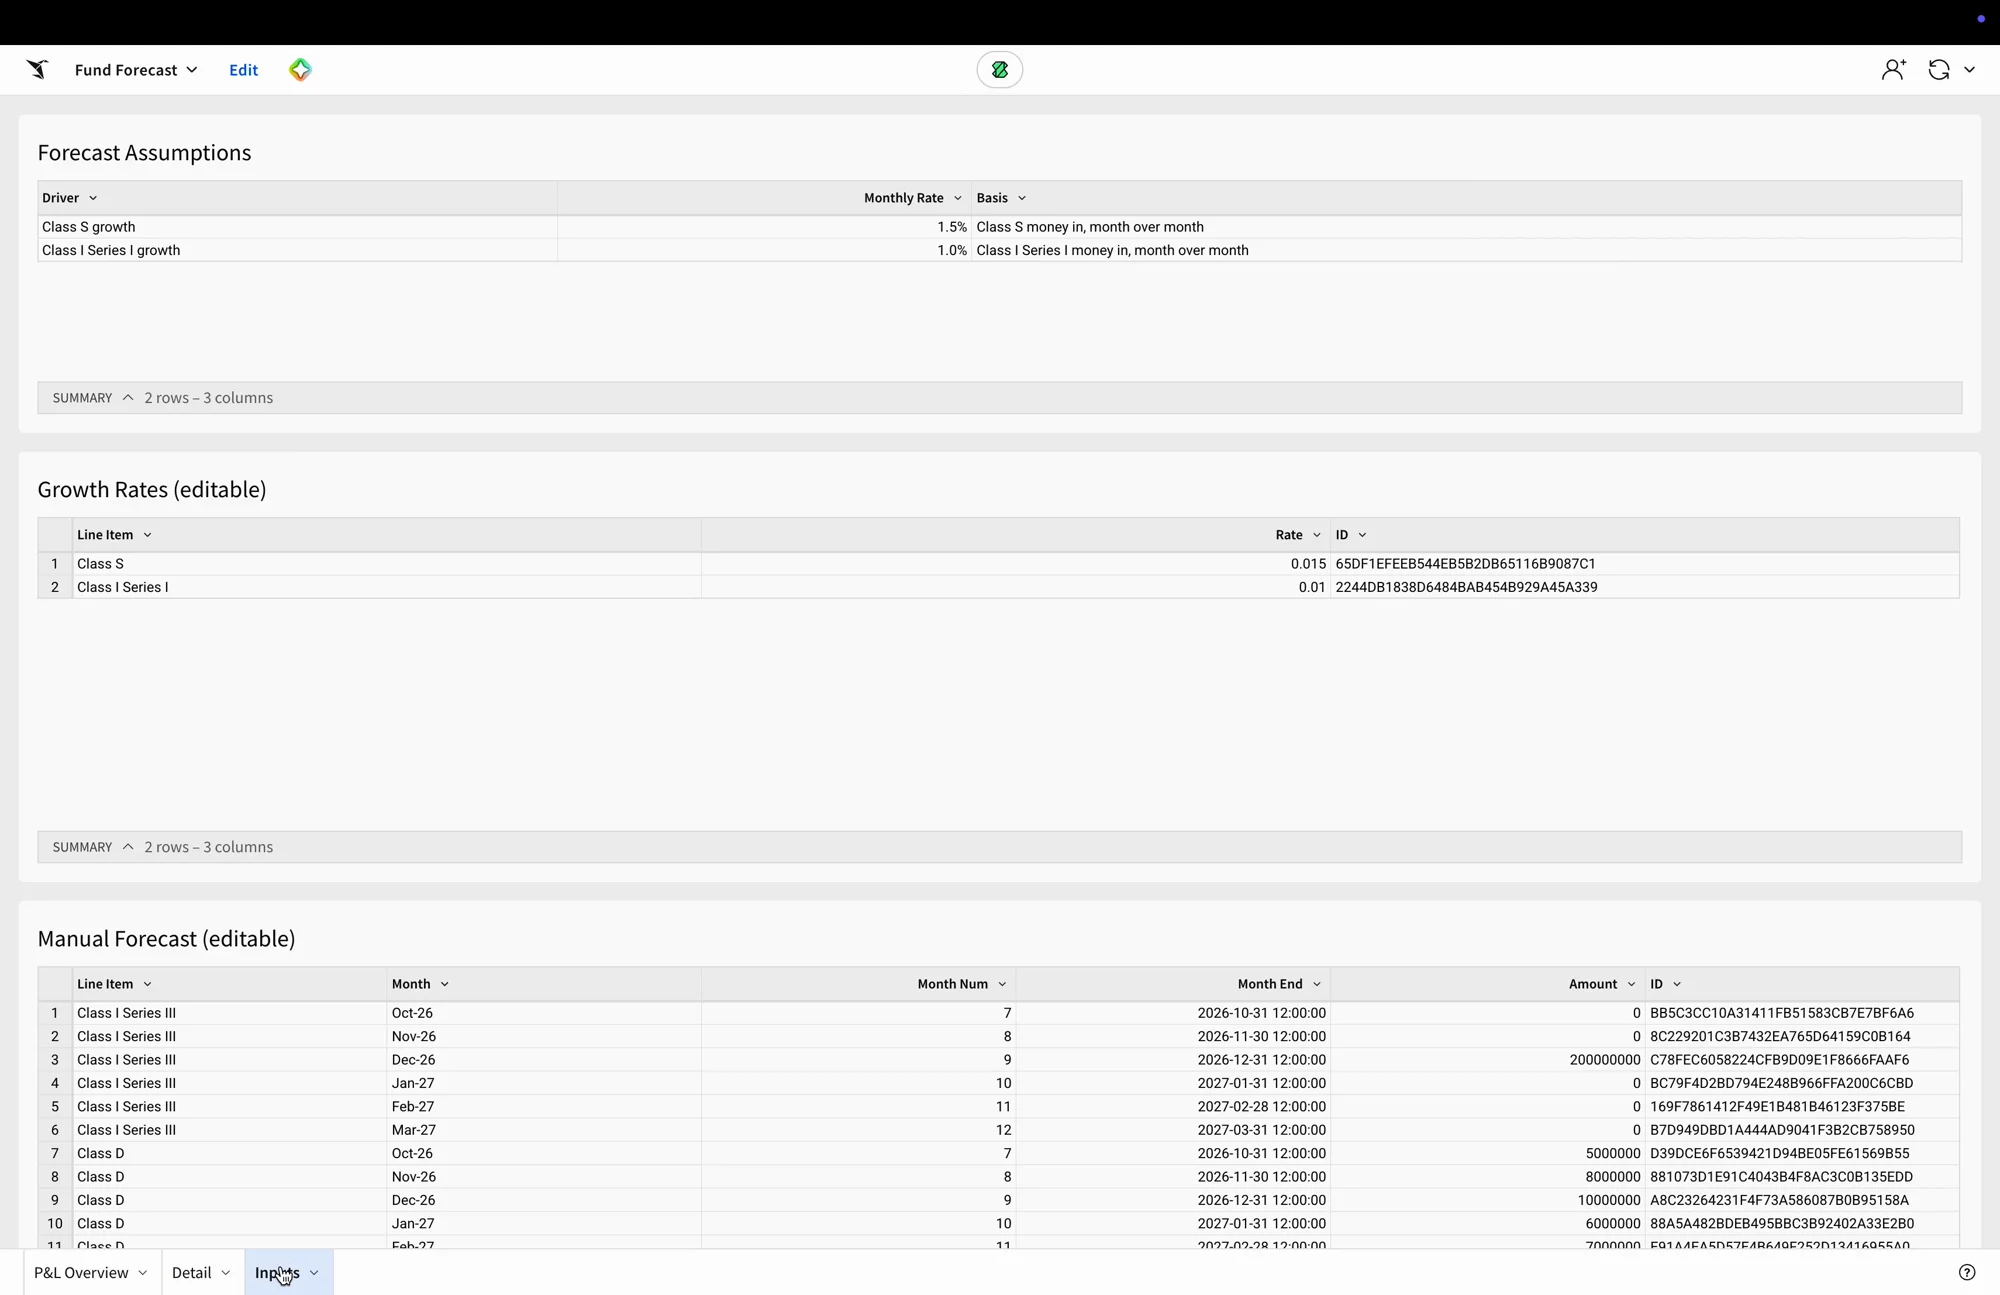
Sigma. The Inputs page. The growth rates and the typed-in forecast amounts are editable tables.
The new rate is saved to Snowflake along with the other inputs, rather than in a separate copy of the file. We then set it back to 1.5%.
Moving the actuals to Snowflake
The skill builds the workbook from the values in the spreadsheet. The editable inputs save to Snowflake, but the actuals are still a copy of what was in Excel. As a separate step, we moved the actuals into a Snowflake table, so the forecast now reads live data instead of pasted values.
Issues we resolved
The skill did most of the work, but a few things needed a person:
- The spreadsheet layout. The skill rejected our first version, because the month headers were formulas and each cell switched between actual and forecast with an IF. We rebuilt the sheet with typed month labels, plain SUMIFS for actual months, and plain growth formulas for forecast months.
- The review sign-off. The skill will not build anything until a person confirms each flagged item. We wrote a short review confirming the Class N carry-forward.
- Empty input tables. After the build, the editable input tables were empty, because the skill expects someone to paste the rows in and publish them in Sigma. We filled them automatically instead.
- Snowflake sign-in. The Snowflake account we first tried required multi-factor sign-in, which blocks password connections from Sigma. We used a different Snowflake connection instead.
- Large data loads. Sending the data in one large batch was rejected, so we sent it in batches of about 100 rows.
How to prepare an Excel forecast for migration to Sigma
Based on what the skill accepted and rejected, check these points before you run it on your own workbook:
- Month labels are typed, not formulas. Our first version calculated the month headers, and the skill rejected it.
- Actual months use plain SUMIFS over a transaction sheet. Keep the raw rows on their own sheet, like our GL sheet.
- Forecast months use one simple method each. A growth rate from a drivers sheet, a typed-in amount, or last month carried forward. Don’t switch between actual and forecast inside one cell with an IF.
- Totals are formulas. The skill uses them to check its work against Excel.
- Someone owns the judgment calls. The skill flags items that need a decision, like our carry-forward line, and waits for a named person to confirm them.
- A warehouse connection with write access is ready. The editable inputs are saved there.
- Plan to fill the input tables after the build. They start empty.
The skill also creates a new workbook each time. It can’t add pages to a workbook you already have, so if the forecast belongs inside an existing Sigma app, someone has to move the pages across. We did that for our own private equity demo.
01 FAQ
Frequently asked questions
Does the skill move my data into a data warehouse?
Not on its own. It saves the editable inputs to your warehouse, but the actuals start as values copied from the spreadsheet. Moving the actuals into a warehouse table is a separate step.
Do the numbers match Excel exactly?
In our test, yes. The skill checked 108 cells before building, and all three totals matched Excel to the cent after the build.
Can my team still change the assumptions?
Yes. Growth rates and typed-in forecast amounts become editable input tables in Sigma. In our test, the input tables were empty after the build and had to be filled once.
Will it work on any Excel forecast?
Only if it follows the layout the skill expects, which is listed in the preparation checklist above. Our first version didn't, and we had to restructure it before the skill accepted it.