What a Sigma Implementation Looks Like, Step by Step
A Sigma implementation involves more than connecting the tool to your data. This guide outlines each stage of the process, from defining business objectives through user adoption and ongoing support.
As a Sigma implementation partner, this is the process we follow with every client, whether they are building reporting for the first time or replacing spreadsheets and legacy tools.
Before we start: what we need from your team
We handle the build, but a few inputs have to come from your organization:
- Access to the systems and files where your data lives today
- A point of contact who understands how the business operates and measures performance
- Time from the people who will use the reports, to review early versions
Step 1: Scoping around business objectives
Most projects do not begin with a list of metrics. They begin with business objectives: growing a product line, improving margins across a portfolio, or giving leadership a clearer view of operations. Leaders often know what they want to achieve without yet knowing how to measure it.
Our first step is to understand those objectives and the decisions behind them, then translate them into concrete questions the reporting needs to answer.
From there, we define the scope in writing, including the reports, data sources, and users, and agree on a fixed price. The consultant who scopes the project also delivers it, which keeps requirements and context intact from start to finish and protects the project from scope creep.
Step 2: Assessing your data
Every organization’s data is in a different place. Some already have a single, well-organized source of truth. Others have data spread across a CRM, an ERP, a billing platform, and dozens of spreadsheets that no one has reconciled.
We start by assessing where your data stands today. If it is already clean and centralized, we connect Sigma to it and move on. If it is scattered or inconsistent, we bring it together, model it, and create a single source of truth before any reports are built.
Step 3: Defining your KPIs
With the objectives and data understood, we define the KPIs that will measure progress. For each KPI, we agree on exactly how it is calculated and under what conditions: whether revenue is reported before or after refunds, what qualifies a customer as active, and which time periods and segments each metric covers.
These definitions are built into a semantic model, a single layer that holds the KPI definitions and business logic for every report. When two teams look at the same KPI, they see the same number, calculated the same way. This step is also where we resolve the most common reporting complaint we hear: different reports showing different numbers for the same thing.
One definition for every report
Each KPI is defined once in the semantic model. Every report reads that definition, so the same KPI shows the same number everywhere.
- 1
Data sources
CRM, ERP, billing platform, and spreadsheets.
- 2
KPI definitions in the semantic model
Whether revenue is reported before or after refunds, what qualifies a customer as active, and which time periods and segments each metric covers.
- 3
Reports
Leadership, finance, operations, and portfolio reports all read the same definitions.
Step 4: Building dashboards and reports
Some clients are building reporting from scratch. Many more are replacing something that already exists. In private equity and finance especially, critical reporting often lives in Excel workbooks that have been maintained by hand for years. Others are moving from tools like Tableau or Power BI.
In either case, we build the highest-priority report first, typically the leadership or finance view, and review it with your team before building the rest. When migrating, we use the existing reports as a reference so that nothing the business relies on is lost. How to Migrate an Excel Forecast to Sigma shows one of these migrations in detail.
Throughout the build, progress is tracked in Flightpath, our client workspace, where you can see the status of each deliverable at any time.
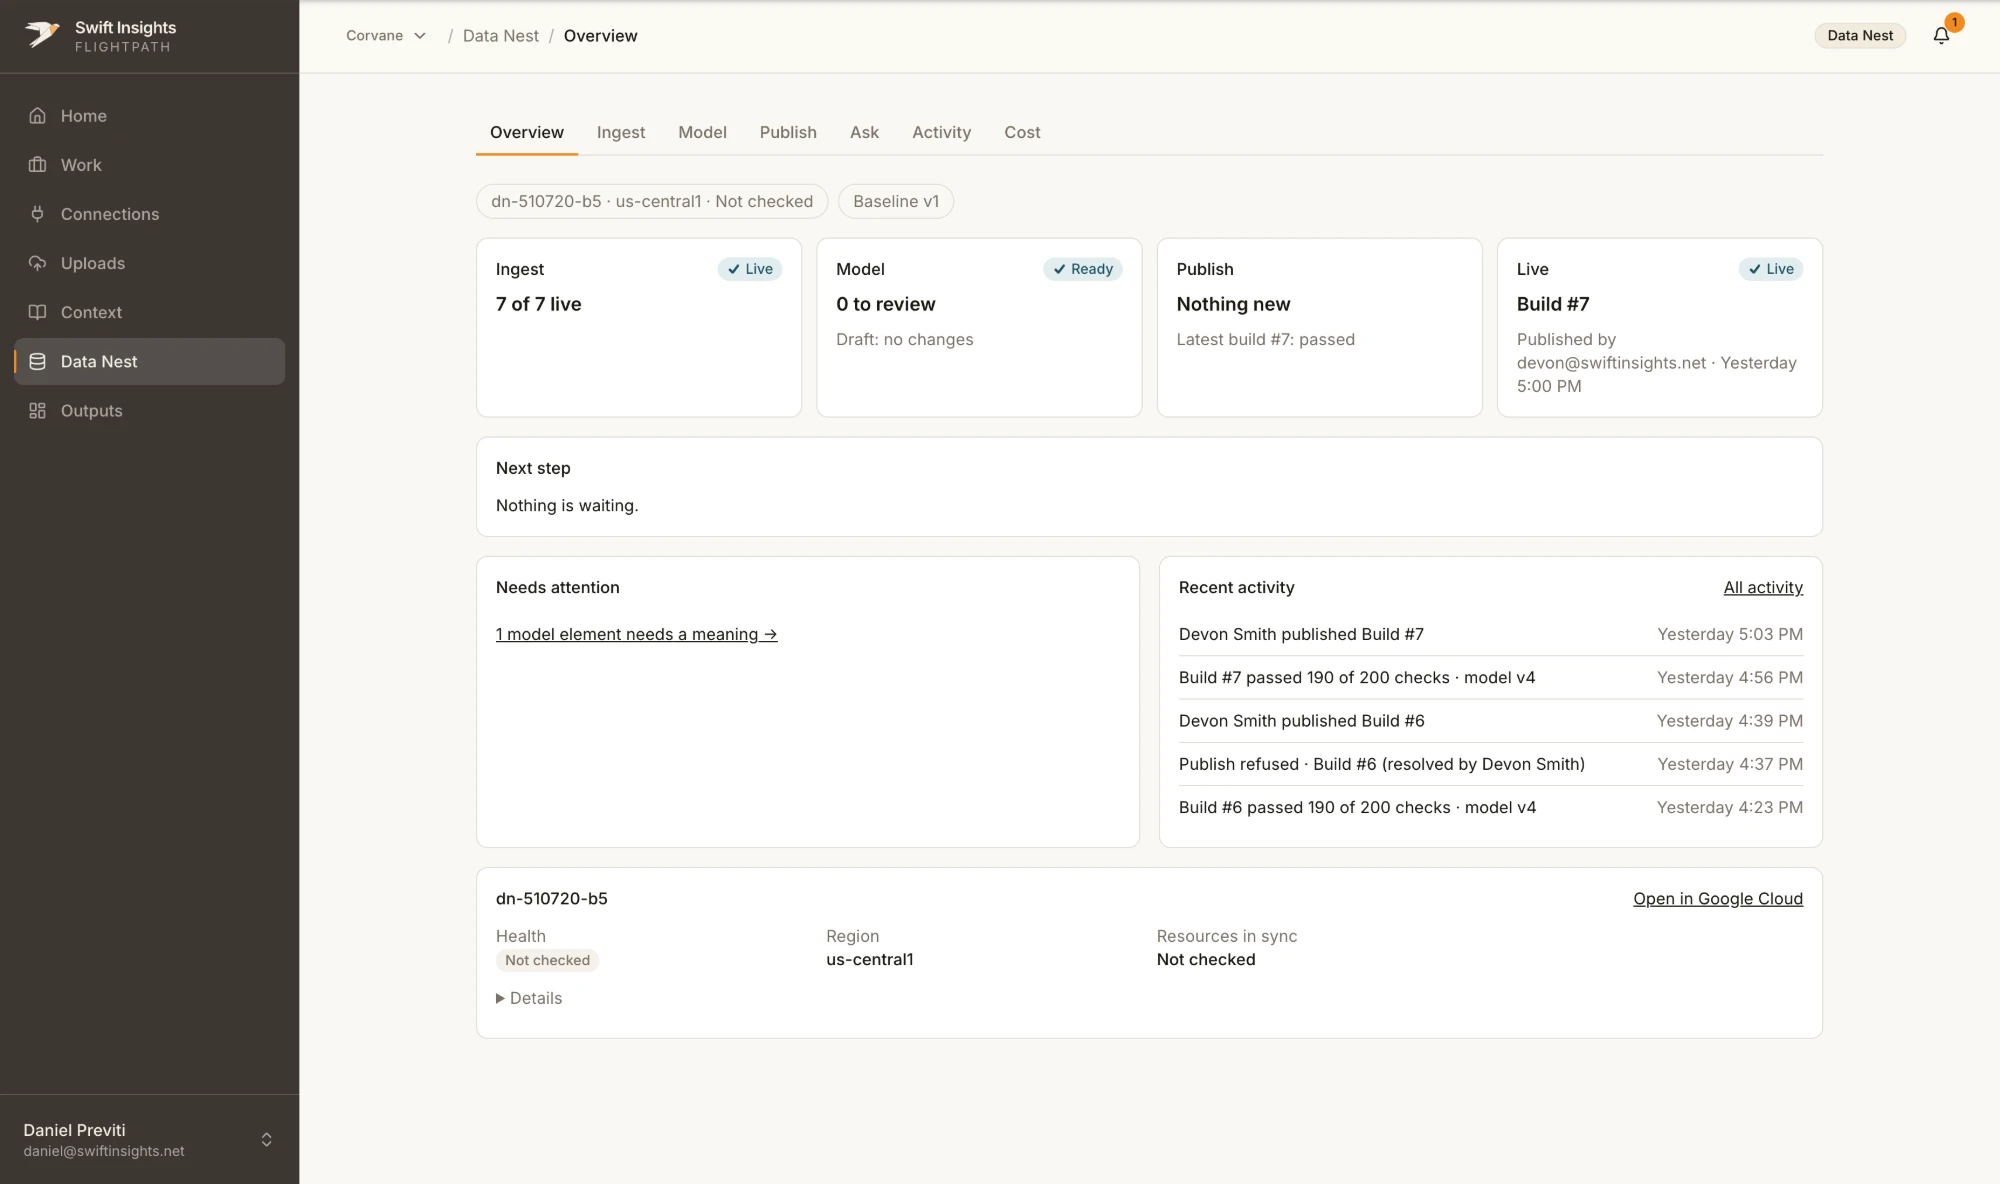
Flightpath shows where each stage of the build stands and what happened most recently.
Step 5: Validating the numbers
Once the reports are confirmed, we reconcile them against the reports and spreadsheets your team currently uses. Any difference is investigated and either corrected or documented with an explanation of why the new figure is accurate. On our own private equity demo, we compared 16 headline numbers, charts, and lists before and after moving its data to Snowflake, and all of them matched.
Step 6: User adoption
Most teams have established workflows, such as a spreadsheet that the same few people have updated and passed around every month for years.
We work with the people who own those workflows to move them into Sigma, show how the new reports answer the same questions with less manual work, and retire the old process once the team is confident in the new one.
Step 7: Training and ongoing support
After delivery, we offer two kinds of continued help. The first is training: we can teach members of your team to build and maintain Sigma reports themselves, using your own data rather than generic examples.
The second is ongoing support. Reporting needs change after launch, whether that means new reports, additional data sources, or views for other teams. We provide post-release support and continued development, with a regular feedback loop so the reporting keeps pace with the business.
01 FAQ
Frequently asked questions
How long does a Sigma implementation take?
Anywhere from a couple of weeks to a couple of months. The timeline depends on the amount of data involved, how organized it is, and how many existing reports need to be migrated. Building from scratch is often faster than migrating reports from several different tools. We provide a timeline as part of scoping.
Do we need a data warehouse?
You don't need one before you start. Sigma runs on a cloud data platform, and Excel and CSV files can be uploaded into it. If you don't have a platform yet, setting up a small one can be part of the project. During the data assessment, we recommend the setup that fits your data today and how you expect it to grow.
Can we move our existing reports to Sigma?
Yes. Most of the reporting we migrate comes from Excel, followed by tools like Tableau and Power BI. Reports are rebuilt in Sigma using the originals as a reference, and every one is validated against its source before the switchover.
Can our own team maintain Sigma after launch?
Yes. Training is designed to make your team self-sufficient for day-to-day changes. Many clients manage routine updates internally and engage us for larger projects.