Sigma vs Power BI: Which One Fits Your Team?
Sigma and Power BI are both strong BI tools, built for different teams. Power BI is strongest in a Microsoft environment with a dedicated team of BI professionals. Sigma is strongest when semi-technical managers and analysts need to build, analyze, and update data themselves.
We implement both. This guide explains each tool on its own, then compares them side by side, so you can answer the deciding questions against your own infrastructure and team.
Power BI: built for a dedicated BI team in a Microsoft company
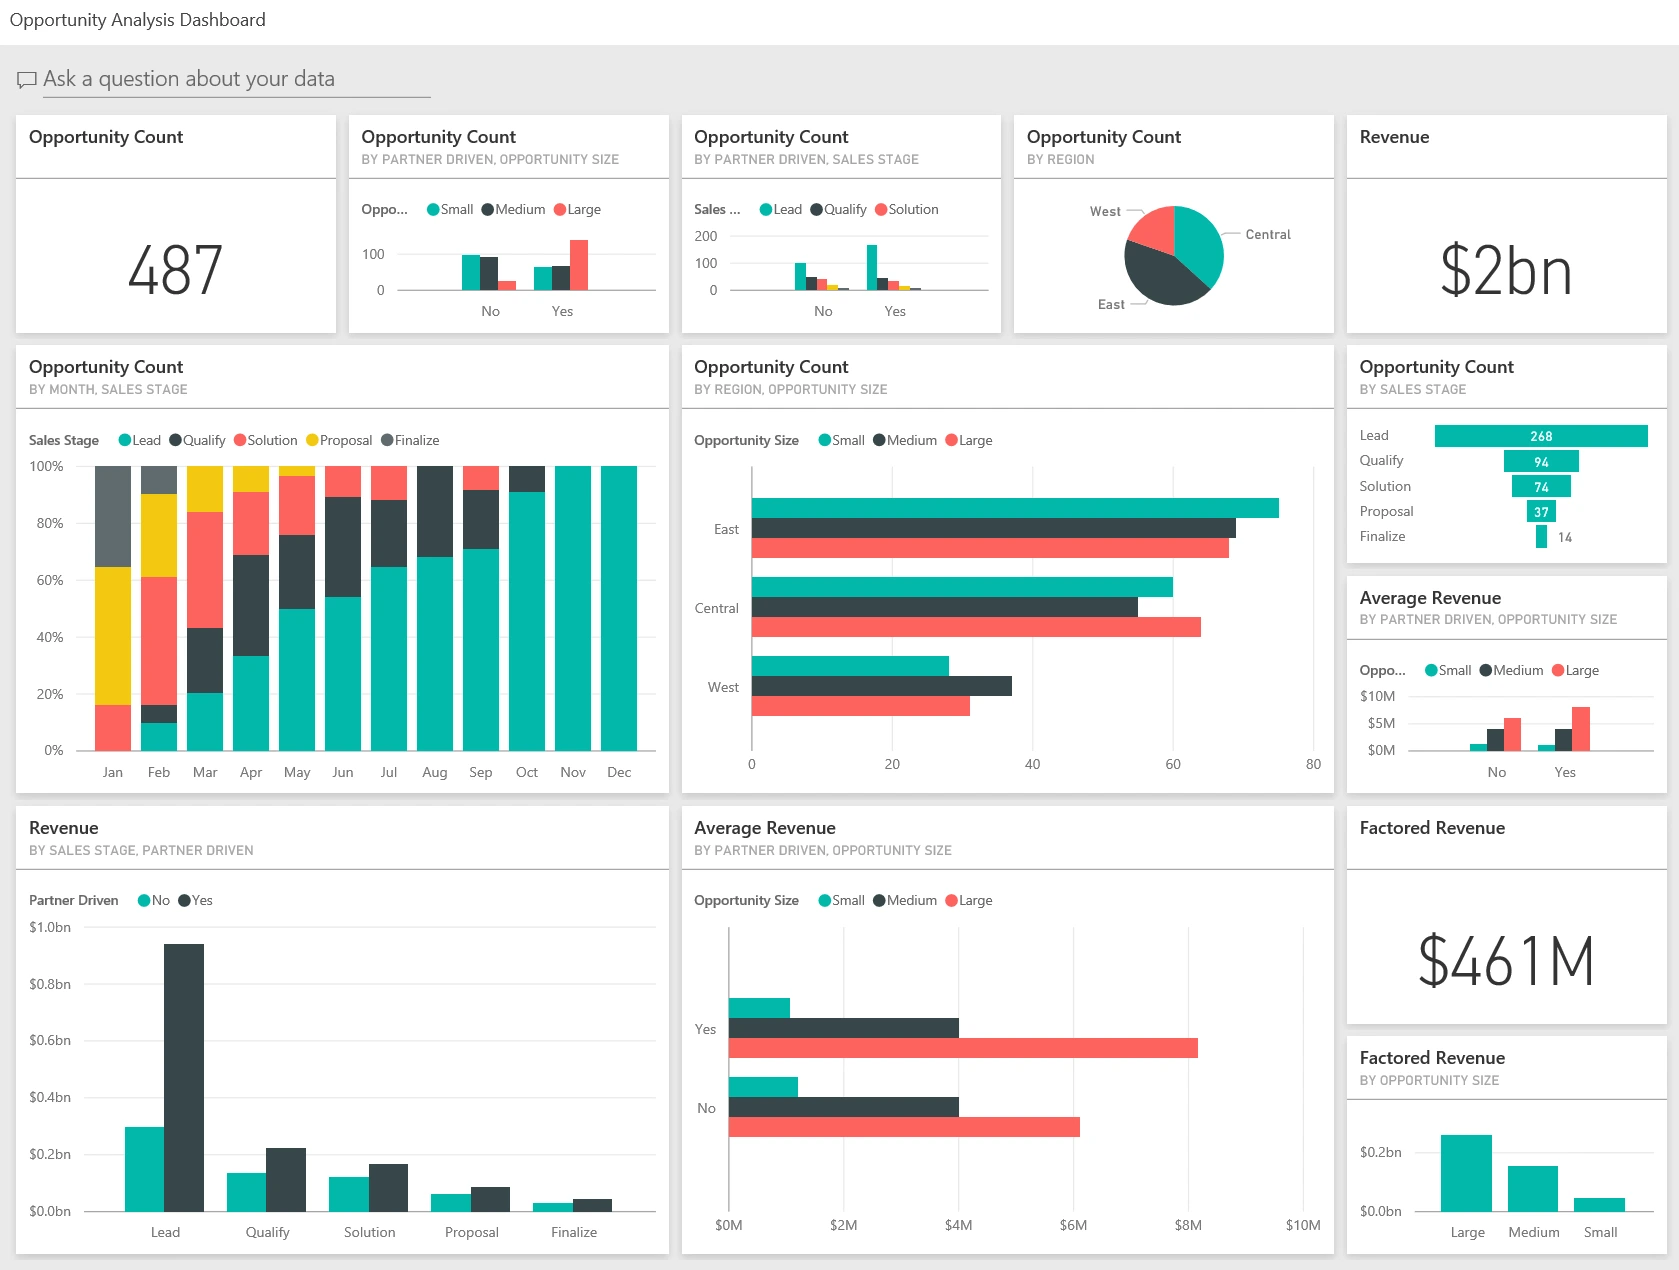
Power BI. A sales opportunity dashboard, designed to be reviewed rather than worked in.
At some companies, a dedicated BI team builds and maintains reports for the rest of the business. Power BI rewards this setup. Building in Power BI means learning DAX, its formula language, and Power Query, its data preparation tool. Together they handle complex models and calculations, and the time spent learning them pays off when the same specialists build reports every day.
Power BI is part of the Microsoft ecosystem. It connects closely with Excel, Teams, SharePoint, Azure, and Microsoft Fabric. Power BI Pro is included in Microsoft 365 E5, so companies on that plan already have it. For a company standardized on Microsoft, that means reports that appear where employees already work and one fewer vendor for IT to manage. Reports can be viewed and lightly edited in the browser, but full report building requires Power BI Desktop, which runs only on Windows. Mac users typically run it through a virtual machine such as Parallels, which adds cost and setup.
Power BI connects directly to a very wide range of sources, including Excel files, SharePoint lists, SQL Server, and many business applications. If your data is spread across many systems and files, Power BI can report on it without a separate project to consolidate it first.
Power BI is designed around dashboards and visual reports. Users can export to Excel or connect Excel to Power BI data, but detailed, cell-level analysis usually happens outside the report. If your team mostly reviews dashboards rather than working through the numbers, this matters less.
Power BI can now write data back through Microsoft Fabric, but each workflow is built by a developer using Fabric’s tools.
Most Power BI reports work from a copy of the data that refreshes on a schedule: up to 8 times a day on a Pro license, or 48 times a day on Premium and Fabric capacity. Power BI can also query some sources live, with some limits on modeling and speed. For a monthly board report, refresh timing makes no difference. For a team managing cash, inventory, or a quarter-end close, a scheduled copy can mean decisions made on numbers that are hours old.
Power BI offers a large library of chart types, plus a marketplace of custom visuals, and gives report builders detailed control over layout. That matters most when reports go to boards, investors, or clients and need a polished, branded presentation.
Power BI has the largest talent pool of any BI tool. Power BI Desktop is free to download, and many developers are self-taught, which makes hiring easier but means experience varies widely. Vetting candidates carefully matters.
Sigma: built for managers and analysts who work in the numbers
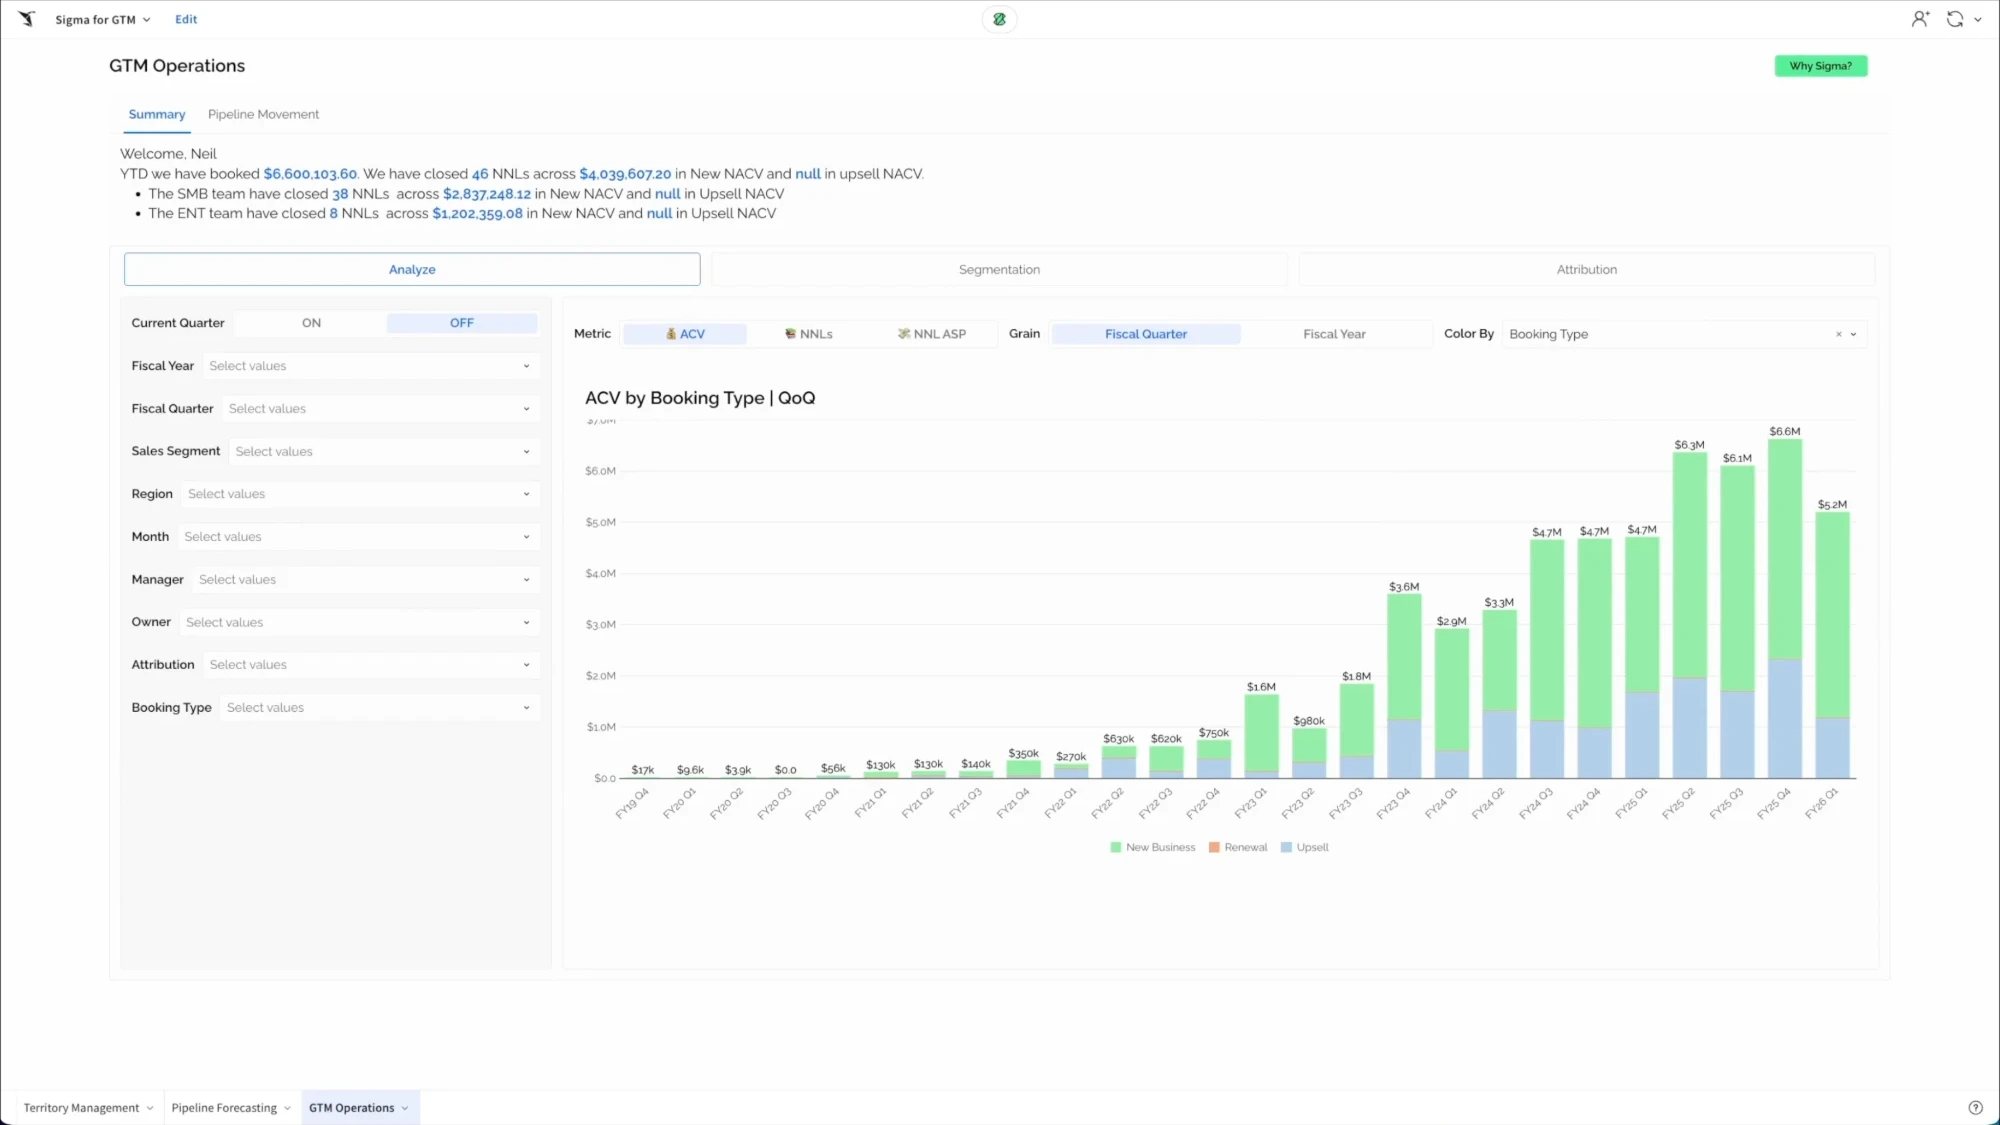
Sigma. A workbook with filters and a bookings chart, built on a spreadsheet-style page.
At other companies, managers and analysts in finance and operations want to build and change their own reports without waiting on a central team. Sigma is built for this. Building reports, modeling data, and entering data are all done through a spreadsheet-style interface, without learning a separate formula or modeling language.
Sigma also fits inside a Microsoft environment. It supports Microsoft Entra ID for sign-in and runs on data platforms hosted in Azure, such as Snowflake and Databricks. It runs entirely in the browser on any operating system.
Sigma runs on a cloud data platform, such as Snowflake, Databricks, or Google BigQuery, and Excel and CSV files can be uploaded into it. If you don’t have a platform yet, setting up a small one can be part of the implementation. For companies that have already centralized their data, Sigma puts that investment to direct use: every report draws from the same source.
For many finance teams, spreadsheet analysis is the deciding factor. Sigma looks and works like a spreadsheet, uses Excel-style formulas, and lets users pivot, filter, and add calculations directly on live data. Teams that already do their analysis in Excel can keep working the way they do today, on centralized data instead of exported copies.
Many finance and operations workflows involve entering data, not just reading it: budgets, forecasts, scenario assumptions, commentary, or approvals. Sigma handles this through input tables, which save entries to your data platform alongside the reported figures. Once an administrator enables it, an analyst can add an input table the way they would add a sheet. If data entry is central to how your team plans and forecasts, who can build and change these workflows has a direct effect on cost and turnaround time.
Sigma queries your data platform each time a report is opened, so figures are always current. The tradeoff is cost: the platform does the work each time, so its usage grows as more people use Sigma.
Sigma covers the charts most business teams use, including bar, line, area, maps, and pivot tables. Its strength is analysis rather than presentation. That suits internal reporting, but heavily branded client or board materials are easier to produce in Power BI.
Sigma’s talent pool is smaller and more specialized, and much of it sits within Sigma and its partner network. Most companies rely on Sigma or a partner for the initial build. Because Sigma is easier to learn, internal analysts can usually take over day-to-day work afterward.
Sigma and Power BI side by side
Where each tool has the edge.
| Question | Power BI | Sigma | Edge |
|---|---|---|---|
| Who builds reports | A dedicated BI team that learns DAX and Power Query | Managers and analysts, in a spreadsheet-style interface | Depends on your team |
| Microsoft fit | Built into Microsoft; Pro included in Microsoft 365 E5 | Entra ID sign-in; runs on Azure-hosted platforms | Power BI |
| Where data comes from | A very wide range of sources and files | A cloud data platform; Excel and CSV uploads | Power BI |
| Spreadsheet analysis | Usually happens outside the report | Done directly on live data | Sigma |
| Entering data | Built by a developer in Fabric | Input tables an analyst can add | Sigma |
| How current the numbers are | A copy refreshed on a schedule | Always current from the data platform | Sigma |
| Charts and design | Large chart library and detailed layout control | Everyday business charts | Power BI |
| Finding builders | Largest talent pool; experience varies widely | Smaller pool; mostly Sigma and partners | Power BI |
What will it cost?
Power BI is licensed per user: $14 per user per month for Pro and $24 for Premium Per User. People who view shared reports also need a Pro license, unless the content sits on a large Fabric capacity (F64 or above). For companies on Microsoft 365 E5, Pro is already included, so the added cost can be low.
Sigma sets pricing for each company individually, and the data platform usage it generates is an additional cost. The more useful comparison is total cost, including the developer time and any extra tools needed to build and maintain reports in each.
Which one sounds like you?
Power BI fits if…
- Your company is standardized on Microsoft
- A dedicated BI team builds reports for the business
- Your data is spread across many systems and files
- Most users review dashboards rather than analyze data
Sigma fits if…
- Managers and analysts build their own reports
- Your team does its analysis in spreadsheets
- You need to enter budgets, forecasts, or other data
- You need up-to-the-minute figures
For how a move to Sigma runs from start to finish, see What a Sigma Implementation Looks Like, Step by Step. If your reporting lives in Excel today, see How to Migrate an Excel Forecast to Sigma.
01 FAQ
Frequently asked questions
Is Sigma a good alternative to Power BI?
For teams that analyze data in spreadsheets, enter data such as budgets and forecasts, or want managers to build their own reports, yes. For companies standardized on Microsoft with a dedicated BI team, Power BI is usually the stronger choice.
Does Sigma work in a Microsoft environment?
Yes. Sigma supports Microsoft Entra ID for sign-in and runs on data platforms hosted in Azure, so it can sit alongside Microsoft 365 and Teams.
Is Sigma more expensive than Power BI?
It depends on headcount and Microsoft licensing. For companies on Microsoft 365 E5, Power BI is usually cheaper on license alone. Sigma's total cost includes the data platform usage it generates, and it can come out lower when it removes developer time or separate planning tools.
Which one is easier to learn?
Sigma, for people who already use Excel. Power BI is quick to start with, but DAX and data modeling take considerably longer to master.
Can we switch tools later?
Yes, in either direction, and from Excel. Reports are rebuilt in the new tool using the originals as a reference. When we migrate reports, we validate each one against the original before the switchover.
Can we use both?
Yes. Some companies keep Power BI for organization-wide dashboards and use Sigma for finance and operations teams that need to analyze, plan, and enter data.