We set up both tools for clients. This guide explains each tool on its own, then compares them side by side, so you can pick the one that fits your company.
Tableau: built for analysts
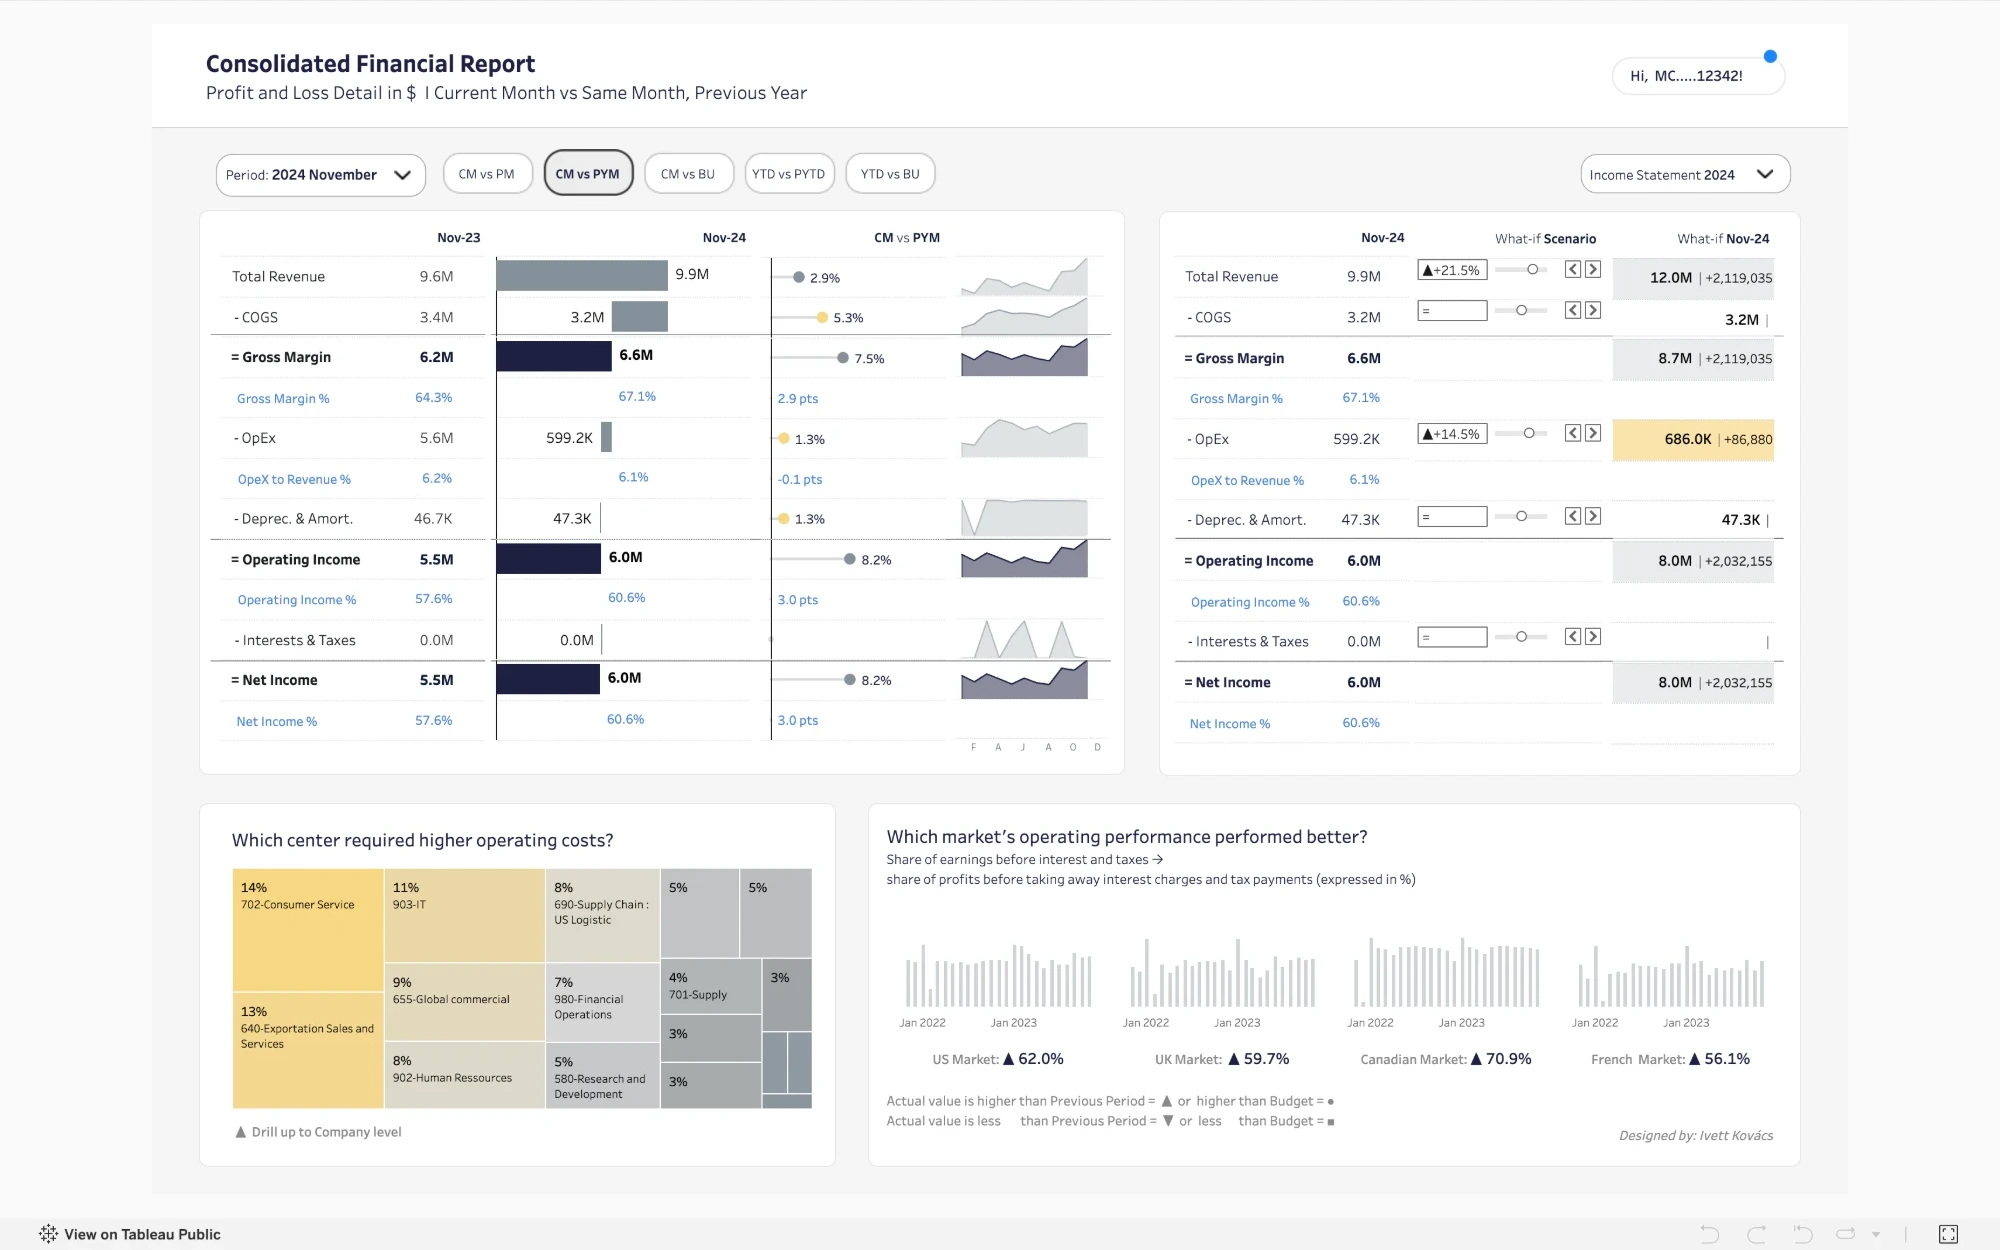
Tableau. A dashboard built by an analyst, with charts and filters laid out on one page.
Tableau fits companies where reporting is centralized: a small group of analysts takes requests and builds reports for everyone to use. It is a very technical tool that takes years to master.
Most people can read a Tableau dashboard right away. Building one is different. Analysts need training to learn how Tableau handles data, calculations, and layout, and it takes a long time to get good at it.
Tableau can connect to almost any data source: spreadsheets, databases, cloud systems, and business apps. It can run online or on your own servers.
Tableau can connect to your data live, but many companies set it up to work from a copy of the data, called an extract. Extracts make reports load faster, but they only update on a schedule, often once a night. If someone checks a number in the morning, they may be looking at yesterday’s figures.
Tableau has more chart types and more control over layout, colors, and interactions than Sigma. If your reports go to executives, clients, or the public and need to look highly polished, Tableau has the edge.
Sigma: built for the teams who own the numbers
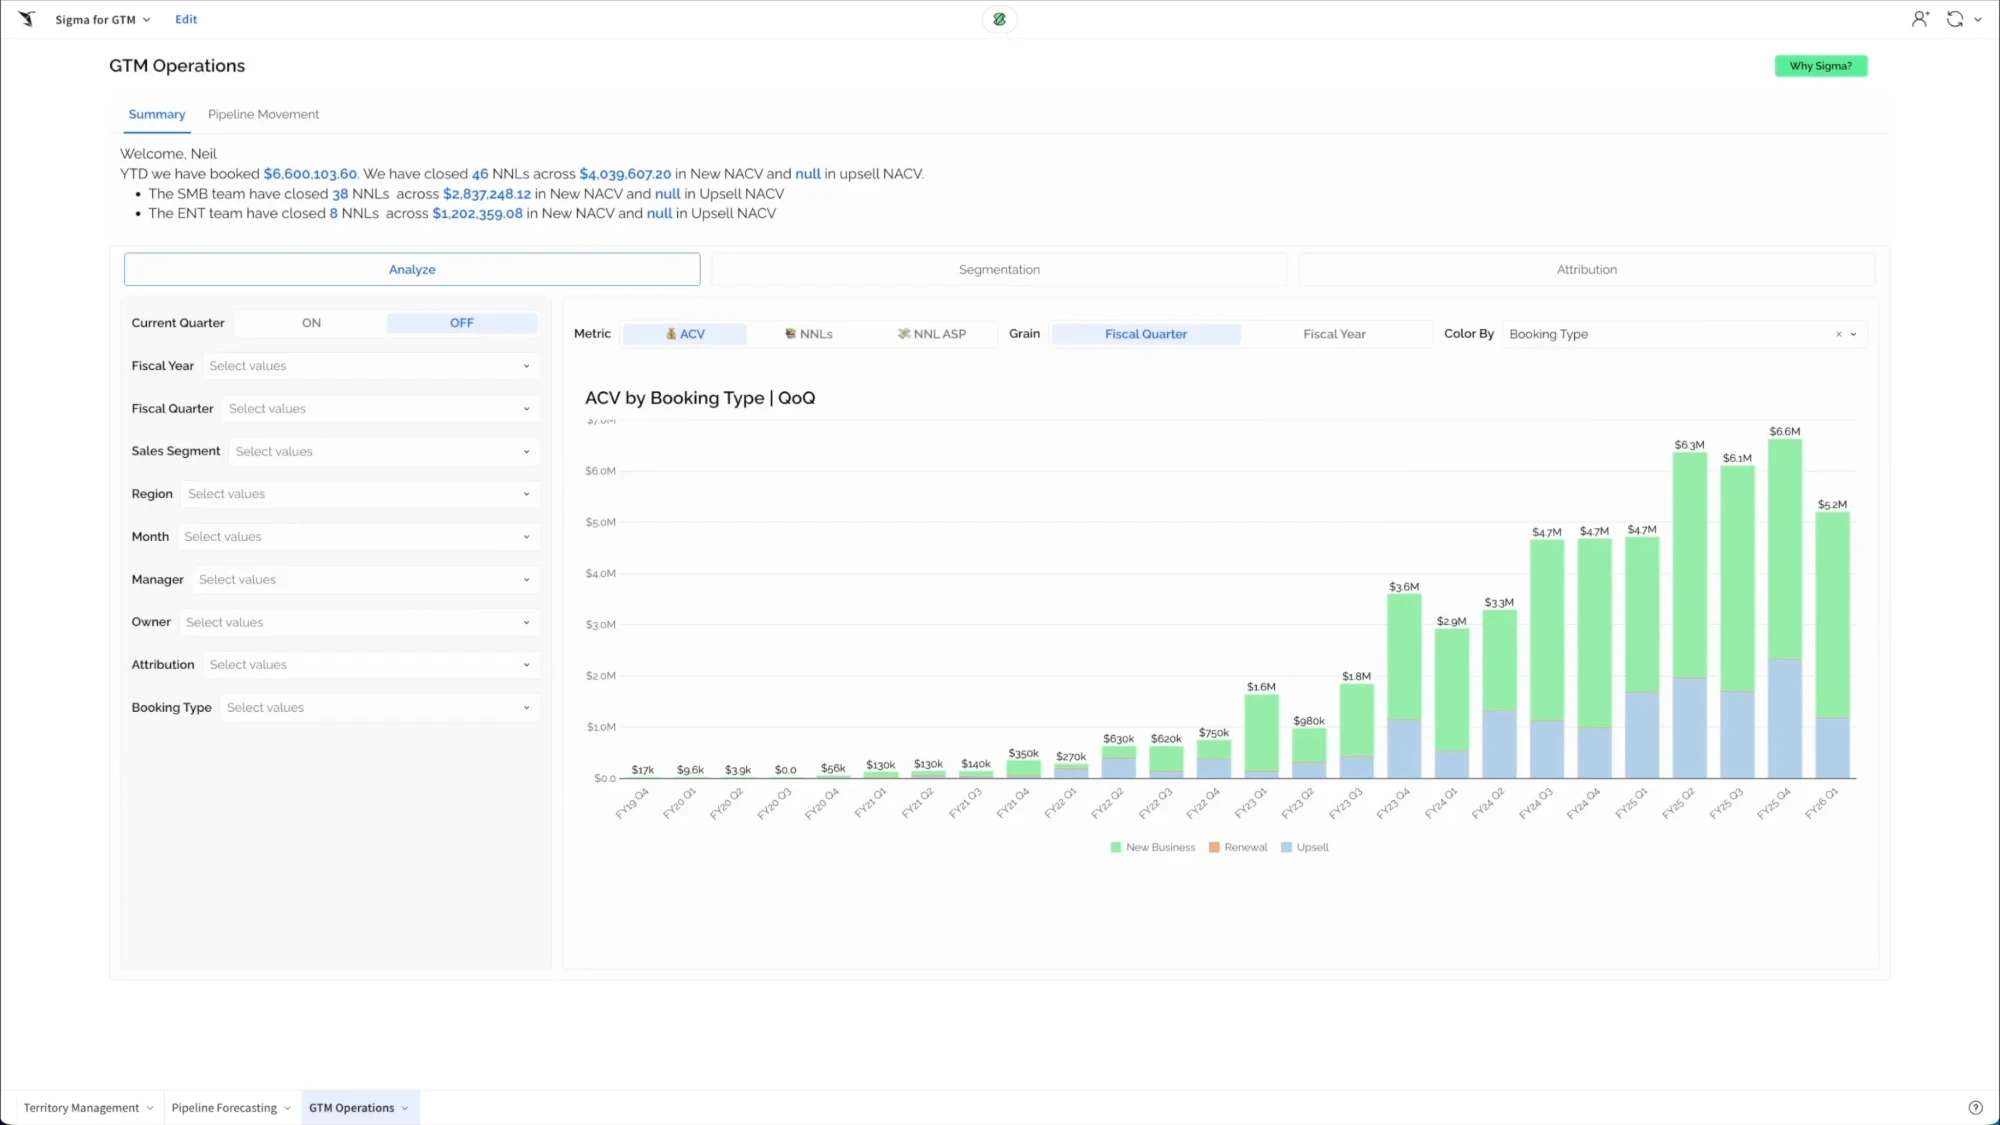
Sigma. A workbook that looks and works like a spreadsheet, with charts on the same page.
Sigma fits companies where reporting is spread out: the people who manage the data, like finance and operations, build their own reports. It works like a spreadsheet, so it’s much easier to learn and more people can build in it. The tradeoff is that it can’t do as much visually as Tableau.
Anyone who is comfortable in Excel can usually start building simple reports in Sigma within a few days. That’s why companies choose it when they want more people building their own reports.
Sigma runs on a cloud data warehouse, like Snowflake, Databricks, or Google BigQuery. Excel and CSV files can be uploaded into it, and if you don’t have a warehouse yet, setting up a small one can be part of the project.
Sigma doesn’t use copies. Every time someone opens or changes a report, Sigma asks the warehouse for the current numbers. This means reports are always up to date, but it also means your warehouse does the work, so warehouse costs can go up as more people use Sigma.
Sigma covers the charts most business teams use every day: bar, line, area, pie, maps, and tables. Its strength is tables and spreadsheet-style views, not custom visual design.
Sigma and Tableau side by side
Where each tool has the edge.
| Question | Tableau | Sigma | Edge |
|---|---|---|---|
| Who builds reports | A small group of analysts | Finance, operations, and other teams | Depends on your team |
| Learning to build | Takes years to master | Simple reports within a few days for Excel users | Sigma |
| Where data comes from | Almost any source; online or your own servers | A cloud data warehouse; Excel and CSV uploads | Tableau |
| How current the numbers are | Often a nightly copy (extract) | Always live from the warehouse | Sigma |
| Charts and design | More chart types and control | Everyday charts; strongest in tables | Tableau |
| Pricing | Per person; builders cost more than viewers | Custom quote, plus warehouse usage | Depends on users |
Putting reports inside your own product
Some companies want to show reports to their own customers, inside their website or app. Both tools can do this, and both let each customer see only their own data.
The deciding factor is usually where your data is kept. If it’s already in a cloud data warehouse, Sigma is often simpler to set up. If it comes from many different systems, Tableau is more flexible.
Switching from Tableau to Sigma
There is no button that turns a Tableau dashboard into a Sigma one, so reports usually have to be rebuilt. The work that carries over is everything underneath the reports: the data in your warehouse and the agreed definitions of each number. When we migrate reports, we check each one against the original before the switchover.
Most companies don’t switch all at once. They start with one team, usually finance, move its reports to Sigma, and keep Tableau running for everyone else until they’re ready.
What about cost?
Tableau charges per person. People who build reports cost more than people who only view them.
Sigma sets a custom price for each company. For either tool, get a quote based on how many people will use it.
Which one sounds like you?
Tableau fits if…
- A small group of analysts builds reports for everyone
- Your data is spread across many systems
- You need to run it on your own servers
- You want highly visual, polished reports
Sigma fits if…
- Finance and operations build their own reports
- Your data is in a cloud data warehouse
- Teams plan, forecast, or budget inside their reports
- Your team is comfortable in spreadsheets
For how a move to Sigma runs from start to finish, see What a Sigma Implementation Looks Like, Step by Step. If your reporting lives in Excel today, see How to Migrate an Excel Forecast to Sigma.
01 FAQ
Frequently asked questions
Is Sigma cheaper than Tableau?
It depends on how many people use it and what they do. Tableau charges per person, so cost grows with every new user. Sigma sets a custom price for each company, but when it runs on your warehouse, you also pay for the warehouse usage it creates.
Can Sigma replace Tableau?
For most companies that mainly need business reports, yes. For companies that need highly designed visuals or have to run on their own servers, Tableau is still the better fit.
Does Sigma work without a data warehouse?
Sigma runs on a cloud data warehouse, but you don't need one before you start. Setting up a small warehouse can be part of the project, and Excel and CSV files can be uploaded into it.
Which one is easier to learn?
Sigma. It works like a spreadsheet, so people who use Excel can start building reports quickly. Tableau takes much longer to learn to build in.
Can we use both?
Yes, and many companies do. A common setup is Tableau for the analytics team's polished dashboards and Sigma for finance and operations, who want to work with the numbers themselves.